Founder's note · 24Observe
Why I Built 24Observe: One Observability Platform for NOC, SOC and AI SRE
Swipe sideways to see the whole diagram.
Why I built an observability platform for NOC and SOC
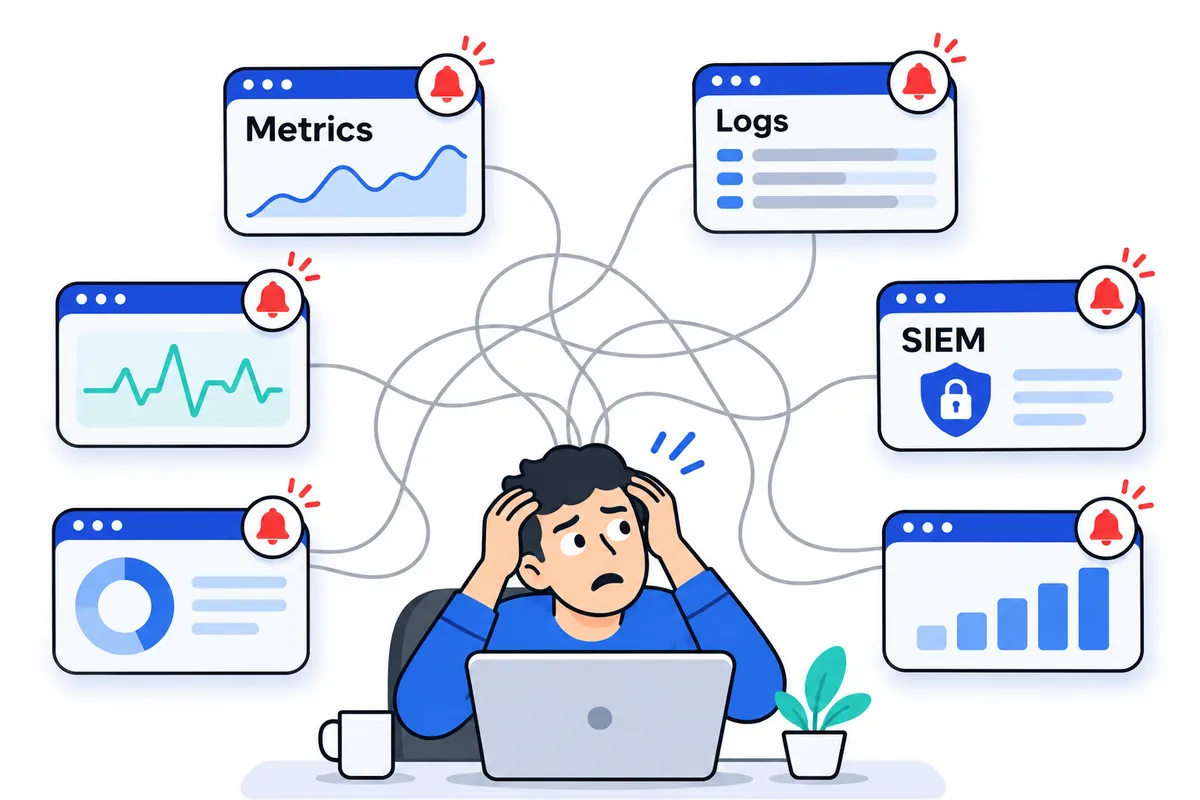
Prometheus handles metrics well, and Grafana provides dashboards. Then come separate uptime monitors, an observability product, a SIEM for security operations, a NOC wallboard and an AI analyst layered above them. Each serves a purpose, but running them together does not automatically create shared context. The operator may still have to assemble an explanation. I built 24Observe to address that work.
There are good engineering reasons to choose those tools. My frustration is with operating them separately, without shared context. Their individual capabilities matter, but so does the work required to connect what they report during an investigation.
An uptime monitor can report that an endpoint failed, while a security alert identifies suspicious activity. A dashboard can show the symptom. Those observations may concern the same host or service, yet the person investigating still has to establish whether they belong together. Another alert does not necessarily help them make that connection.
I built the platform with a clear design priority: helping people understand what is happening across products. That keeps my attention on the investigation: the available evidence, the relationships between records and what another person needs to continue the work. Useful tools can still leave the operator responsible for assembling that picture.
24Observe’s internal monitoring footprint includes Networkers Home. That internal use shapes how I think about the product. The operational workflow has to make sense across products, beyond what a demonstration dashboard can show. I want the evidence to remain useful as an investigation moves between operational and security questions, without making the person investigating explain the environment again.
The work between the tools
Tool sprawl creates work between otherwise capable systems. Someone has to compare timestamps, reconcile service names, match an IP address to a host and decide whether separate notifications describe related symptoms. The findings then have to travel from the operational investigation into the security investigation, or the other way around. When that context lives in a person’s head, every handoff requires explanation.
The NOC and SOC ask different questions, but they often need overlapping evidence. Availability and service health are the NOC’s concern. The SOC investigates suspicious activity and affected identities or assets. Both may need the same host logs and IP address, along with the incident history. Keeping those responsibilities clear should still allow people to work from shared evidence.
A security analyst should be able to investigate a host with its operational history available. An operator investigating service failure should have access to relevant security signals without starting an unrelated search elsewhere. That was the workflow I wanted: each person could follow the evidence relevant to their work, including records from the other side of the investigation.
Adding an AI analyst above disconnected tools leaves the same design problem. Its investigation depends on the evidence it can reach and the relationships it can establish. I wanted AI SRE and security investigation to work from shared operational context. Otherwise, the AI analyst becomes another destination that needs its own explanation of the environment before it can contribute to the investigation.
That requirement shaped how I wanted NOC, SOC, observability and AI SRE to work together. Evidence needed to follow an investigation across those responsibilities. The relationships between signals, resources, identities and incidents had to remain available, rather than leaving the investigator to reconstruct them at each step.
My design requirements start with the records a person needs to examine. As an investigation moves between operational and security questions, the workflow should preserve what has already been established. That is the work I want 24Observe to support, including when another person needs to pick up the investigation.
The workflow I wanted to build
My starting requirement was one platform with one data store and one set of incidents. Monitoring, observability and security operations needed to share that foundation. Otherwise, I would still be asking people to reconcile separate versions of an investigation, even with the dashboards behind a common navigation menu. A shared menu alone would leave that work unchanged.
24Observe combines uptime checks, browser checks, logs, metrics, traces and SIEM in one product. Traces are a signal the platform ingests and uses to feed the context graph. The monitoring, observability and SIEM capabilities share the data store and incidents, giving those workflows a common operational record. That shared record is the foundation I wanted for investigations across the platform.
The context graph links hosts, users and IP addresses across incidents. I wanted those relationships available during an investigation, so someone examining an alert could also examine the resources and identities it touches. The graph brings those connections into the investigation instead of leaving the person working on it to reconstruct them from separate records.
Log management also had to account for what happens after the immediate investigation. Recent evidence is useful for diagnosis; retained evidence supports later review. The platform provides searchable cold-storage retention and an exportable, hash-chained audit log. Retention needed to be part of the platform’s design, rather than another disconnected operational requirement to manage after the immediate work was done.
These decisions explain why I built 24Observe as a shared platform. The workflow should let an operator follow a failed check or security signal into the evidence without losing the investigation’s context. That path should preserve context across NOC, SOC, observability and AI investigation. The underlying records need to remain available for a person to examine and verify as the investigation continues.
24Observe monitors over 30 of our own products
24Observe monitors over 30 products from my own group companies. These are businesses I run, and their monitoring is the first evidence I want to put behind the platform. I need that evidence to be understandable to the people using it, including me.
I use 24Observe to monitor our portfolio because I expect to run my own companies on the platform I ask you to trust. That means taking responsibility for monitoring our infrastructure and using the same platform I am asking you to evaluate.
I founded Networkers Home in 2007. That history is part of why I want to show where 24Observe is used. A feature list alone gives you less to evaluate than seeing where I use the platform myself. The monitoring footprint includes OllaVPN, MeshWG, NHPREP, OllaDNS, QuickZTNA, QuickSDWAN and OllaSoftware, alongside Networkers Home.
The monitoring questions matter more to me than the product count. A product’s name alone tells you too little about its function or monitoring configuration. I start with the evidence an operator needs to understand a problem, then look at what monitoring should help establish.
| Monitoring question | What I need monitoring to help establish |
|---|---|
| Endpoint reachability | Whether endpoints are reachable, and what host and network evidence explains a failure |
| Name resolution | Whether resolution works, rather than assuming a reachable host means the service works |
| Access activity | How access events relate to the identities, hosts and addresses involved |
| Connectivity | Whether connectivity symptoms have supporting evidence in device and host telemetry |
| Web content | Whether web content renders as expected, beyond receiving a successful HTTP response |
| Service impact | Which service is affected and what evidence the operator should investigate |
Those requirements leave room for different monitoring configurations across products. A DNS check and a browser check answer different questions. Authentication events need a different interpretation from a disk metric. I want to preserve those differences while keeping the evidence in a shared operational system, so each requirement does not need a separate system of its own.
Tool sprawl makes that an engineering problem. Prometheus collects and queries metrics; Grafana builds dashboards around data sources. Both do their jobs well, as do dedicated uptime monitors and SIEM tools. The burden comes from managing separate products, each with its own alerts, logins and view of the same problem. I want shared context rather than separate views that an operator has to piece together.
I built 24Observe to consolidate that management burden. It combines uptime checks, browser checks, logs, metrics and SIEM capabilities. Monitoring, observability and security operations share a data store and a set of incidents. The context graph connects hosts, users and IP addresses across incidents, giving an investigation relationships to work with.
Across our own portfolio, I want that shared evidence to stay useful and the investigation to remain understandable. This internal footprint gives you a specific basis for evaluating my claim: I use 24Observe within my own group companies. Whether it fits another deployment still needs to be evaluated against that deployment’s monitoring requirements.
One observability platform should share its data and incidents
I define consolidation through the data model and the incident model. A feature checklist cannot tell me whether the evidence is connected well enough to investigate a problem.
An uptime monitor, a log search screen and a security dashboard can sit beside each other while still operating as separate products. If I have to reconstruct the relationship between their alerts during an investigation, the integration has left the difficult work to me.
I built 24Observe around that requirement: connect the evidence through a shared data model and incident model so I can investigate across it.
Different signals, one set of incidents
24Observe combines uptime checks, browser checks, logs, metrics, traces and SIEM in one product. Monitoring, observability and security operations share one data store and one set of incidents. The feature overview describes the capabilities; the shared model explains how they work together.
Each signal keeps its meaning. A failed browser assertion is evidence about a rendered page. A CPU threshold breach points to resource pressure. When events meet a detection rule’s conditions, the match becomes evidence for investigation. These signals enter a shared incident pipeline:
| Signal | What opens the incident | Context and investigation around it |
|---|---|---|
| Failed uptime or browser check | A check failure meeting the monitor’s configured failure threshold | Affected-service context and AI investigation of the operational failure |
| Metric breach | A configured threshold breach, such as CPU, latency or free disk | Related entities, logs and metrics for investigating the breach |
| Detection match | Events matching a detection rule’s conditions | Implicated identities, hosts and assets, with AI investigation of supporting evidence |
These incident sources automatically trigger AI investigation when organization-level LLM use is enabled. The analyst uses read-only investigation tools and returns a verdict with cited evidence.
Separate incidents can exist within that shared model. Incidents sharing a root in the context graph can be grouped into a case, while the NOC and SOC work from the same set of incident records. That is how I define a shared incident model.
Notification support varies by signal. Monitor checks support PagerDuty, Opsgenie, SMS and voice routing; those destinations remain on the roadmap for log alerts. The shared incident model currently has that routing boundary, and I want operators evaluating the product to see it clearly.
Shared evidence needs relationships
Putting telemetry in the same product gives an investigation somewhere to start. I also need relationships between the records to work out how the evidence connects.
The Context Layer builds a read-only, per-tenant graph from telemetry already being sent. Its engine runs on a schedule and derives relationships from logs, ingested traces, monitors, incidents, on-call information, assets and audit logs. Hosts, users and IP addresses can therefore be connected across incidents.
The AI analyst can traverse that shared context graph. The graph helps narrow the search; the underlying records remain the evidence used to confirm a finding. I keep that distinction clear when describing what the graph provides.
24Observe ingests traces as a signal that feeds the context graph. Its current capabilities do not include APM, distributed tracing or real user monitoring. Trace ingestion serves the context model, and those product categories remain outside what 24Observe currently offers.
“One store” describes the product model
I use “one store” to describe the shared product data model. The self-hosted stack uses multiple database engines, each with a specific engineering responsibility.
Postgres stores entities, ClickHouse stores time-series check results, and Redis handles queues and sessions. Monitoring and security capabilities share the product’s incident model across those components. The database engines support different parts of the stack within that shared model.
When I evaluate consolidation, I look at what happens during an investigation. I want to follow a failed check, a metric breach or a security detection into the shared incident model and examine the related evidence. That is how I built 24Observe, and how I want operators to evaluate its approach to consolidation.
How uptime monitoring and synthetic monitoring work for the NOC
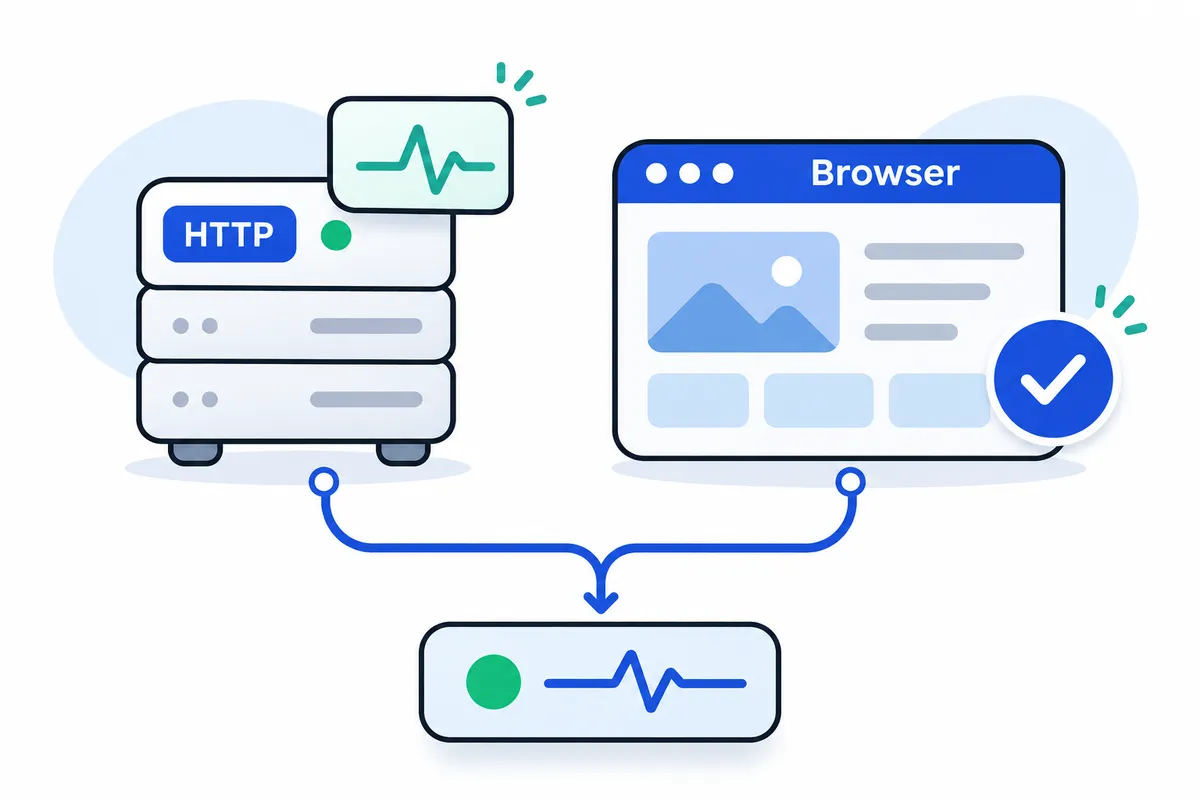
When I configure a monitor, I want to know exactly what its check proves.
A host answering ping does not prove its application works. Even an HTTP response does not prove the browser rendered the content a user needs. Scheduled jobs can stop completing while their servers remain reachable.
Different uptime monitoring check types establish different things, so I choose the one that matches the condition I need to verify. Their failures enter the same incident workflow.
Choose the check that matches the failure
24Observe supports HTTP/S, TCP, SSL/TLS, ping, port, keyword, DNS and heartbeat monitors. I choose the check according to the condition I need to detect.
| Check type | What I use it to establish |
|---|---|
| HTTP/S | Check website or API status codes, response time, redirects and headers. |
| TCP | Test whether a TCP connection succeeds, with a configurable connection timeout. |
| SSL/TLS | Validate the certificate chain and track certificate expiry, with SNI support. |
| Ping | Check host reachability through ICMP. |
| Port | Probe a specific port, including an explicit port override. |
| Keyword | Assert that the raw response contains, or does not contain, expected content. |
| DNS | Check DNS separately from application availability. |
| Heartbeat | Detect when a scheduled job fails to send its expected completion ping. |
For scheduled work, I need to establish that the job completed. Heartbeats reverse the direction of the check: the job calls its heartbeat URL after successful completion. If that ping misses the configured interval plus grace period, an incident opens. The next heartbeat resolves it. A reachable machine alone cannot tell me whether that work finished.
Check the response and the rendered page
HTTP and keyword checks inspect the raw HTTP response. Browser checks load a full HTTPS URL in headless Chromium, execute JavaScript and evaluate the rendered DOM.
For a hypothetical example, consider a page that returns HTTP 200 and an HTML application shell. This is not an outage from our products. After hydration, the page should display “Account overview.” A broken JavaScript bundle or failed data request prevents that content from appearing.
An HTTP status check can pass in this case. A raw-response keyword check cannot establish that the expected post-hydration content appeared. A browser assertion against “Account overview” can detect its absence after JavaScript executes.
I use both checks to establish what the server returned and whether the application rendered the expected content. Those are separate questions, and I choose assertions for each.
Browser monitors support:
containsandnot_containsrendered-content assertions against the DOM after JavaScript executes.- An optional expected status code for document-status assertions.
- A
timeoutMssetting that determines how long the page may take to load before the result counts as down. - A
degradedResponseTimeMsthreshold that marks a slow but loaded page as degraded rather than up.
A failed keyword assertion, a load timeout, or a 4xx or 5xx response produces a down result. Browser response time measures time to the load event, so I interpret that measurement accordingly.
Browser checks run in a dedicated execution pool, separate from the standard check pipeline. Browser monitors cannot target private, loopback or cloud-metadata addresses. The SSRF guard checks the initial navigation, every redirect and every sub-resource request, so a page cannot bypass those restrictions through an embedded resource.
The browser-monitor documentation covers these settings and boundaries.
Use regional checks within their documented limits
For multi-region HTTP/S monitoring, a check always runs locally and can add Cloudflare Workers checks in weur, enam, apac, oc, sam and afr.
This multi-region mechanism currently supports HTTP and HTTPS only. I do not apply a global-region count to browser, ping, DNS, TCP or heartbeat checks.
Checking from multiple locations helps distinguish an endpoint failure from a disruption affecting one network path. I still need to choose the right assertion: regional HTTP success cannot establish that post-hydration content rendered correctly.
Turn failures into incidents, then verify the operating procedure
A threshold breach opens a first-class incident with severity. Uptime incidents use the platform’s shared incident handling and route through configured escalation policies and on-call schedules. They escalate when the recipient does not acknowledge them.
Monitors can be grouped into public status-page components, including browser monitors. Incident updates can appear there too. When the service recovers, the next successful check marks the monitor up and the triggering incident automatically resolves.
Before relying on a monitor, I work through this operational checklist:
- Open the monitor detail page and inspect recent checks, including failures, status codes and errors. Confirm the check measures the condition you intended.
- Send the monitor’s test alert to every configured channel. Inspect each pass or fail result and its exact error.
- Set the failure threshold deliberately.
alertThresholddefaults to one consecutive failure. Raise it when repeated failures should be required before an incident opens. Browser monitors follow the same rule. - Schedule maintenance windows for individual monitors or the organization. Checks continue, alerts pause, and uptime calculations are affected. Account for that behavior when reviewing planned work.
A SIEM tool should start with detections and Sigma rules on day one
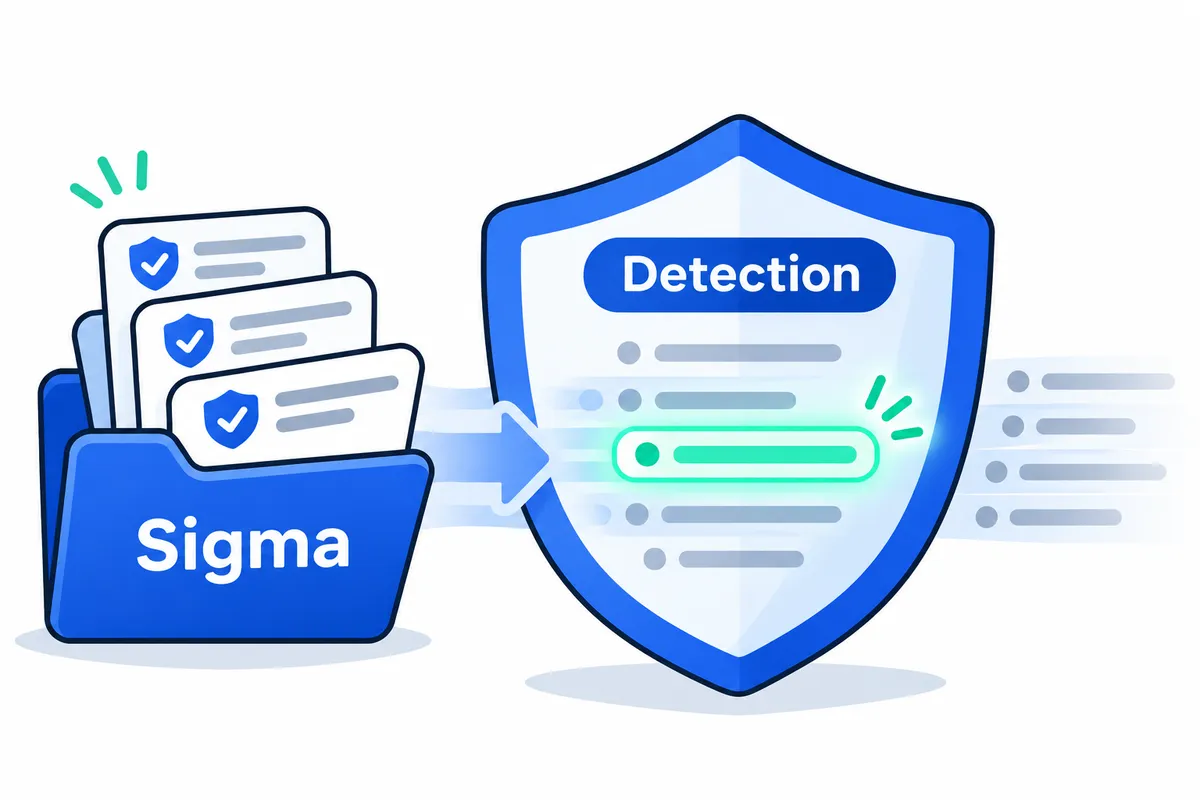
I want a new organization to have detections ready when it starts sending telemetry. Getting that data into a platform already takes work. Writing every initial security rule should not be another prerequisite for evaluating it.
In 24Observe, new organizations receive seeded detection packs and Sigma rules on day one. The documented inventory is 87 prebuilt detections across 14 packs. That count refers to detections; it does not establish a count of 87 Sigma rules.
Sigma is a general format for describing detection logic against log events. It gives security teams a structured way to express suspicious activity. Receiving Sigma rules does not establish universal import compatibility or automatic conversion from every other detection engine.
The SIEM product page documents the detection engine, correlation, enrichment and investigation workflow. I evaluate those capabilities together because an investigator still has work to do after a rule matches.
What the seeded detections look for
The prebuilt inventory spans security and operational signals. These are the documented detection areas and examples:
| Detection area | Examples of signals covered |
|---|---|
| Authentication abuse | Brute-force attempts, password spraying, account lockouts, disabled multi-factor authentication and new privileged accounts |
| Data exfiltration | Bulk exports, unusually large outbound transfers, database dumps and unexpected outbound channels |
| Secret exposure | Credentials, keys and tokens appearing in logs, URLs or request bodies |
| Web attacks | Injection, traversal and scanning visible in application-edge events |
| AI-agent threats | Prompt injection, runaway tool loops, token and cost abuse, sensitive tool use and tool-protocol manipulation |
| Cloud control-plane changes | Root usage, key creation, audit-trail tampering and console abuse |
| Linux host security | New users, privilege escalation, scheduled-task and SSH-key persistence, reverse shells and reconnaissance |
| Infrastructure and reliability | Memory exhaustion, full disks, kernel faults, service crash loops, interface or routing failures, fatal errors and error-rate spikes |
Threat-intelligence matches are another detection area. Most prebuilt detections carry a recognised attack-technique mapping, giving an investigator a reference for the behaviour being flagged.
I use this inventory as a starting point for evaluation and tuning, with the understanding that a prebuilt rule library cannot establish complete security coverage for an environment.
A pack needs the events it watches
Detection packs are telemetry-gated. They remain quiet until the relevant events arrive.
An authentication pack needs authentication logs. Web-attack detections need the application-edge events that expose those requests, while a cloud control-plane rule needs the corresponding cloud-security events. Enabling a pack does not create visibility into a source that has never sent telemetry.
Packs can be enabled with one action, and thresholds can be tuned to the environment. When I evaluate a pack, I first confirm that the source is sending events and inspect the fields the detection needs. Then I assess whether the rule and threshold fit the activity.
A quiet screen can mean nothing matched, or it can mean the necessary evidence is missing. I check which condition applies before drawing any conclusions. Neither condition proves that an environment is secure.
Custom detections use the search language
When the seeded logic does not describe your environment, you can write a custom detection using the same query language used for log search.
Each detection has five parts:
- Query: the events to match.
- Window: the period over which to evaluate them.
- Threshold: the condition that makes the match actionable.
- Severity: the priority carried into the incident.
- Attack-technique tag: the technique associated with the behaviour.
I prefer this model because an investigator can work from a search without learning a separate scripting dialect for detections. Custom rules use the same incident pipeline, routing and investigation process as prebuilt rules. Detections evaluate the live log stream as events arrive, without operating on a separate copy of the logs.
Multi-event correlation handles relationships that a single matching event cannot establish. Sequence rules can identify failed logins followed by a successful login for the same account. Cardinality rules can identify one source touching multiple distinct accounts. Correlation evaluates every minute and can join on any field or attribute.
Normalize and enrich before investigating
Authentication logs, web-server access logs, firewall events and cloud-security events are normalized during ingestion so detections can work consistently across source formats.
Threat intelligence also runs inline. Public addresses are checked against known-bad indicators, anonymising networks and listings, with matches flagged on incoming events. Organizations can supply private indicators covering addresses, domains and file fingerprints, scoped to their own organization.
An indicator match can trigger a detection and provide corroborating evidence during investigation. I still expect the analyst to examine the surrounding activity before drawing a conclusion from a reputation flag.
A matching rule enters the shared incident pipeline
A match opens an incident carrying the rule’s severity and attack-technique tag. Security, monitoring and observability share one data store and one set of incidents.
Security cases group incidents across detections and correlations, tracking status, severity, assignee, notes and disposition. Related incidents sharing a root cause are grouped into one case with one notification.
With organization-level LLM opt-in, the analyst investigates using read-only tools and returns cited evidence. Analyst-proposed remediation requires human approval. The analyst never automatically executes actions such as blocking a source, forcing a password reset or isolating a host.
What AI SRE and an AI SOC analyst should return after an incident
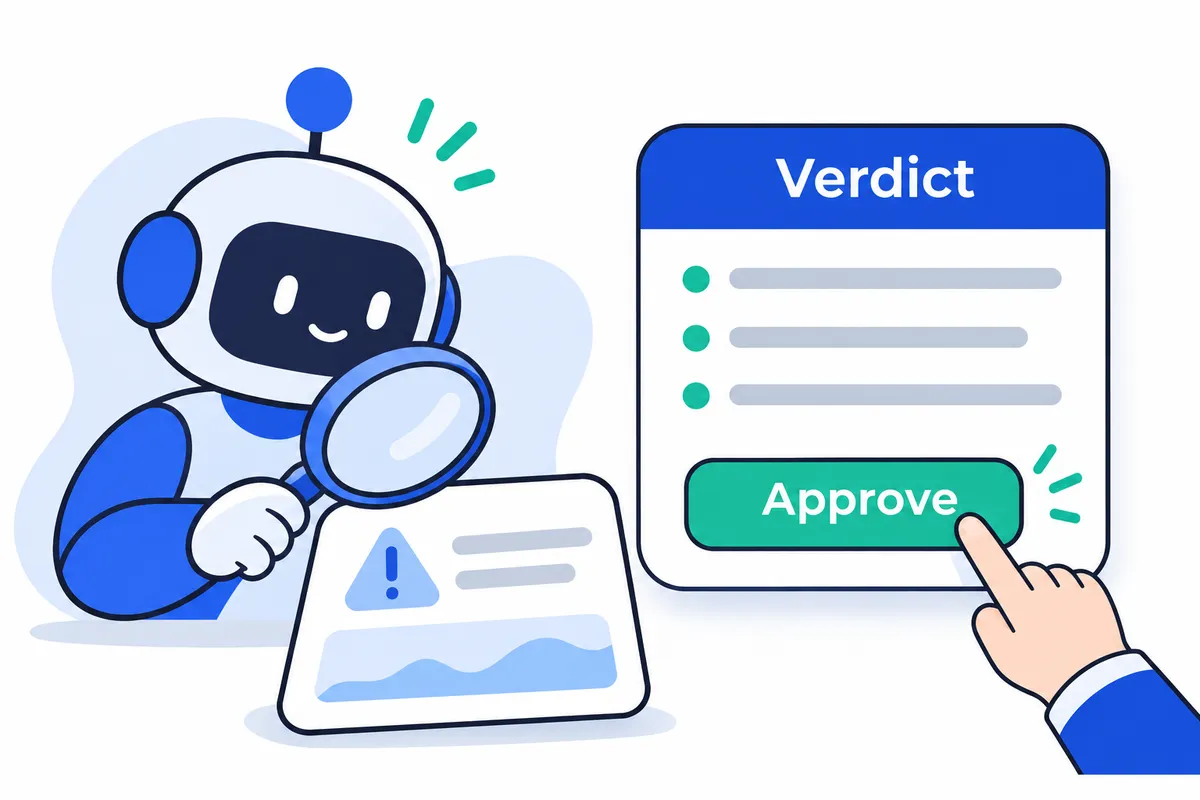
I define AI SRE through the investigation workflow. An incident opens, the analyst gathers evidence, tests a hypothesis and returns a finding that an engineer can inspect. Autonomous infrastructure control sits outside that definition.
I judge that workflow by the evidence it returns and the permissions it requires. I want the investigation to move forward without giving a model permission to change the environment it is investigating.
With organization-level LLM opt-in enabled, the 24Observe AI analyst investigates incidents opened by failed checks, security detections, metric thresholds and hosts that stop reporting. It classifies the incident as an operational failure or a security threat and investigates accordingly.
The output has to be reviewable
A useful investigation should leave the next person with enough evidence to accept, challenge or continue it. Every incident receives a verdict and a reasoning trace. The written verdict includes confidence, affected resources, supporting evidence and a recommended fix.
I expect those outputs to answer specific questions:
| Output | What it should establish |
|---|---|
| Verdict | What happened, including the failing component and its trigger where the evidence supports that conclusion. |
| Reasoning trace | The investigation record supporting the finding, so a reviewer can follow the evidence behind it. |
| Evidence citations | Openable references to the relevant changes, metric values, exact log lines and flagged indicators. |
| Confidence | How strongly the available evidence supports the finding. |
| Disposition | Whether the incident is confirmed, benign, transient or needs-a-human. |
| Affected resources | Which services, hosts, identities and assets the incident reaches. |
| Proposed fix | The recommended action for a human to approve and execute. |
By “reasoning trace,” I mean the analyst’s investigation record. A telemetry trace is a separate signal that 24Observe ingests and uses to feed the context graph. I keep those terms separate so a reviewer knows whether they are looking at the investigation record or an ingested telemetry signal.
Use the graph to narrow the question, then test it
The analyst starts with the incident’s reach. Service relationships, host placement and ownership information help establish which resources are involved. The context graph narrows the search; the underlying telemetry supplies the evidence needed to confirm a finding.
For an operational investigation, consider failed checks across several services. The analyst looks for a shared upstream component and retrieves recent changes around the incident. A change immediately preceding the failure becomes a potential cause to investigate.
That timing gives the analyst a hypothesis to test. It reads relevant logs and metrics to look for a mechanism: host saturation, increasing latency, retry storms or filling disks. Its verdict cites the numbers and log lines supporting the conclusion.
I expect the distinction between timing and evidence to remain visible in the finding. “A deployment happened nearby” is weaker than a finding that identifies the failing component, its trigger and the telemetry connecting them.
A security investigation asks different questions. The analyst corroborates the detection across independent indicators, including known-bad addresses and threat-feed matches. It considers successful logins after repeated failures, sensitive-file access, privilege escalation and signs of data leaving the environment. It also follows the incident to affected identities, hosts and assets.
With a shared incident and data model, the analyst can investigate operational and security evidence in the same platform rather than starting with disconnected views of the same event. I expect citations for security findings just as I do for operational findings, with uncertainty visible in both.
Model choice comes after permission and redaction
LLM use requires organization-level opt-in. Organizations can bring their own LLM key, and the analyst supports either the default model or a customer-provided model. The underlying model can change without changing the investigation workflow.
I keep model choice separate from what I expect an investigation to deliver. Whichever model is selected, the result should be an evidence-cited verdict with confidence, disposition, affected resources and proposed actions.
Investigation data passes through redaction to remove secrets and sensitive data before reaching the model. I want that boundary before model access, where it can limit what the model receives.
Investigation permission stops before remediation
The analyst’s investigation tools are read-only. They can query logs, read metrics, traverse the context graph and retrieve recent changes. During an investigation, the analyst cannot modify monitors, rewrite detections or change systems.
Proposed remediation is queued for human approval and execution. A rollback, restart, scaling change, failover, block or isolation can appear as a recommendation. The analyst never executes that recommendation automatically. The runbook documentation provides the operational reference for the person handling the incident.
Needs-a-human is a valid disposition when the evidence does not support a firm conclusion. When evidence is thin or contradictory, the analyst states the uncertainty and routes the incident to a person.
Reviewers can confirm or downgrade verdicts, correct dispositions and add notes. Those corrections feed back as guidance for future investigations. I want that review to preserve the distinction between what the telemetry established, what the analyst proposed and what a human decided to do.
Uptime monitoring alerts should close when the service recovers
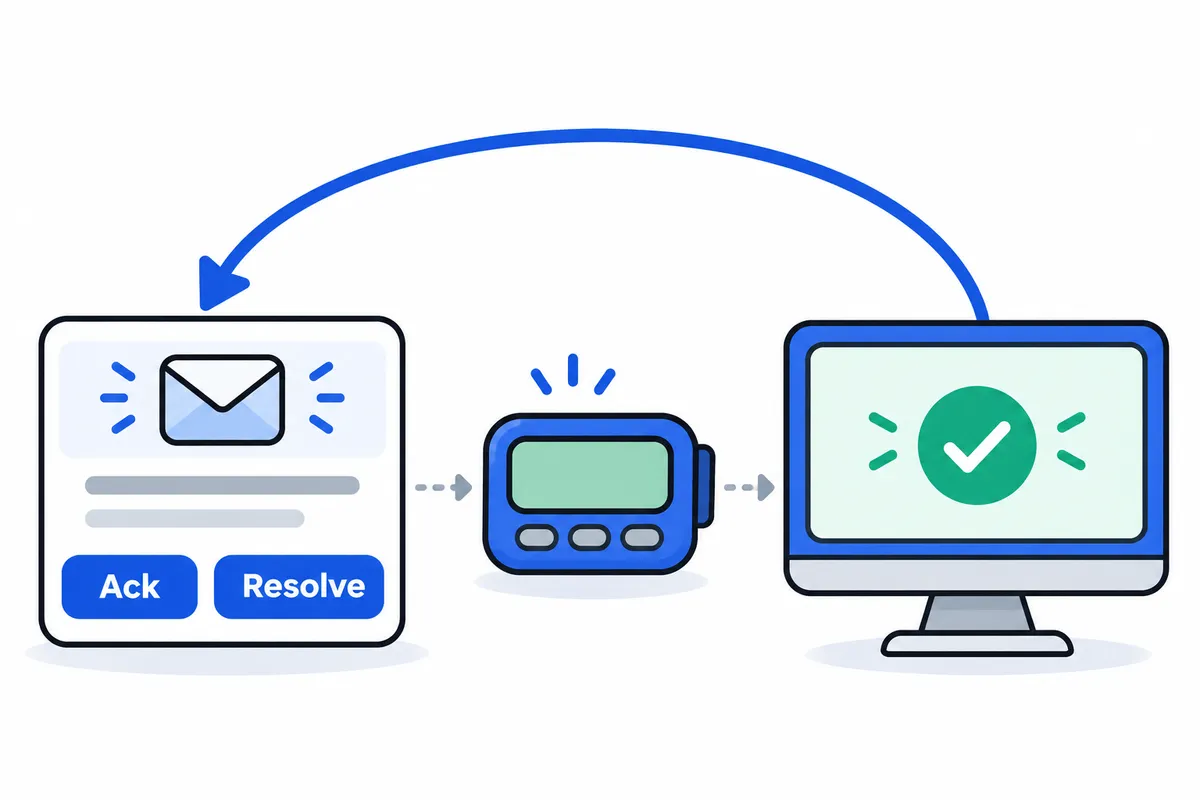
I follow an uptime incident through failure, notification, acknowledgment, recovery and resolution. Sending the first alert covers only part of that workflow. If the service has recovered while the monitoring and paging incidents remain open, the operator has another reconciliation job.
I built 24Observe to reduce that kind of tool sprawl. The monitoring state, incident state and downstream paging state need a defined path back to resolved.
Acknowledgment means someone is investigating
In 24Observe uptime monitoring, a monitor threshold breach opens an incident automatically. The alert threshold controls how many consecutive failures are required before that happens. Notifications then follow the configured escalation policies and on-call schedules.
I keep acknowledgment and resolution separate because they answer different operational questions:
| Action | What it communicates |
|---|---|
| Ack | Someone has seen the incident and is investigating. The incident remains unresolved. |
| Resolve | The incident is being closed. Acknowledging it alone does not do this. |
Incident emails include one-tap Ack and Resolve actions. An operator can acknowledge from the email while leaving the incident unresolved. That acknowledgment records an investigation, without establishing that the service is healthy. The dashboard also supports acknowledgment, so other team members can see that someone is investigating.
If the recipient does not acknowledge the incident, it escalates up the notification chain. I want an unanswered notification to follow an explicit policy rather than leave everyone assuming somebody else has picked it up.
Recovery should close the monitoring and paging loop
Once the service recovers, the next check automatically marks the monitor as up. When the triggering condition clears, the incident automatically resolves.
The monitor observes recovery, and resolution follows. That automatic resolution records the recovery; it does not mean 24Observe repaired the service. The AI analyst’s proposed remediation requires human approval and is never executed automatically by the analyst.
I also want teams to retain paging products that already work for them. PagerDuty supports on-call incident response. Opsgenie supports alert routing. They are separate products, and 24Observe’s monitor alert integrations carry the incident lifecycle through to those tools, including recovery:
- With PagerDuty, when the monitor recovers, 24Observe sends a resolve event so PagerDuty can automatically close its incident.
- With Opsgenie, when the monitor goes down, the integration creates a P1 alert with a deterministic alias. On recovery, it closes that alert using the same alias.
PagerDuty, Opsgenie, SMS and voice routing currently support monitor checks. Those routing options remain on the roadmap for log alerts.
Test delivery, plan maintenance and group related failures
Before relying on a monitor, I test its alert channels. A saved destination still needs a delivery test. A monitor can send a test alert to every configured channel, and the result reports pass or fail for each destination, including the exact error. The operational runbook covers that verification path.
For planned work, maintenance windows can cover an individual monitor or the whole organization. Checks continue running while alerts pause, and maintenance windows affect uptime calculations. I account for that behavior when reviewing availability.
Shared-root failures need different treatment from unrelated failures. Alert-storm correlation groups incidents that share a root in the context graph into one case with one notification. The operator gets a common investigation instead of separate notifications for each related incident. Grouping requires a shared root, so it makes no promise that unrelated alerts disappear.
What a context graph adds to every log investigation
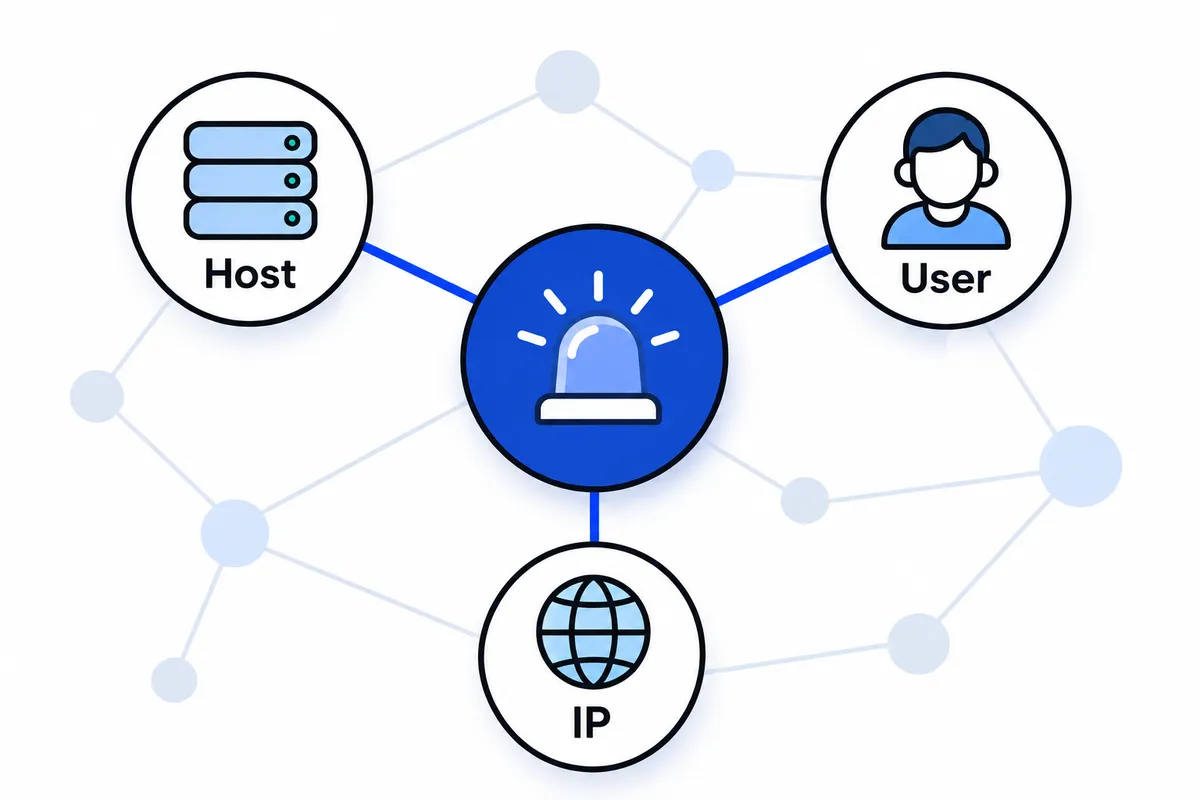
I start with context at ingestion: GeoIP, IP reputation, IOC matching and ECS-style fields. Before I follow relationships between systems, I want each log event to carry the information available about it.
In 24Observe, source-IP enrichment adds geography and network-organization information. Threat-intelligence checks evaluate public source addresses against known-bad indicators and reputation information. IOC matching can also use private, organization-specific indicators. Normalization gives supported logs a shared field structure, including ECS-style fields for OpenSSH authentication and nginx or Apache access logs.
Each enrichment has limits. An application error may contain no source address, and a private address does not provide usable public-IP geography. An event without a matching identity record cannot acquire meaningful identity context simply because it passed through an enrichment pipeline.
Enrichment describes an event
Maintained identity and asset directories add another layer. When an event matches those records, ingestion can attach identity risk and asset criticality.
I can then investigate the event alongside information about the account or asset involved. That depends on someone maintaining the directory and the event containing enough information to match it. I want that boundary visible rather than implying every log arrives with a complete identity and asset profile.
These per-event enrichments tell me which address appeared in a record, what intelligence matched it and what directory context was available. To follow relationships across records and incidents, I use the context graph.
The graph connects operational entities
24Observe’s Context Layer builds a read-only, per-tenant graph from telemetry already being sent. There is nothing additional to install.
The entity graph connects hosts, users and IP addresses across incidents. The broader operational graph includes services, assets, identities, on-call people, AI agents, changes, monitors, cases and IOCs. Ownership and responsibility appear as relationships, alongside connections such as calls, runs_on, impacts, changed and matched.
The engine runs on a schedule, deriving those connections from existing logs, monitors, incidents, on-call information, assets and audit logs. Traces are another ingested signal feeding that graph.
An investigation often needs to extend beyond the event that triggered the incident. A failed monitor identifies a symptom. From there, I need to find the service involved, the host it runs on, the responsible owner and any relevant preceding change. I want those connections available without asking an operator to reconstruct them from separate searches every time.
Every relationship needs supporting evidence
Every edge in 24Observe carries confidence, recency and evidence linking to the exact supporting record. Depending on the relationship, that record can be a log, trace, incident or audit entry. Entity neighborhoods return one-hop relationships ranked by edge strength and recency, with filtering by relationship type.
Those details affect where I spend time during an investigation. A recent, well-supported relationship deserves attention before a weaker or older connection, though neither deserves unquestioned acceptance.
Confidence describes the relationship’s support, while recency tells me how current that support is. I can open the evidence link to inspect the record that produced the connection. That gives me a way to narrow an investigation and still check the underlying records before accepting an explanation.
Following a hypothesis back to telemetry
For a hypothetical incident involving a failing service, I would start with its incident context summary. It returns affected services, responsible owners and changes preceding the incident, with evidence links for each item. From there, I could inspect the service’s neighborhood to understand its host placement and connected services.
Suppose a preceding change appears relevant. I now have a hypothesis to test: did that change contribute to the failure?
I would open the supporting change record, then search the underlying logs around the incident and examine the relevant metrics. I would look for a mechanism consistent with the hypothesis, such as errors beginning after the change alongside host saturation or increasing request latency.
If the logs and metrics do not support that explanation, the preceding change remains a candidate. Temporal proximity alone does not establish causation. I use the graph to decide where to look, then check the telemetry to determine whether the explanation holds.
The same context through REST and MCP
The context documentation covers four read endpoints and their MCP equivalents:
| REST read operation | What it returns | MCP tool |
|---|---|---|
| Entity lookup | Resolves a name to an entity ID | context_lookup_entity |
| Entity retrieval | Type, canonical key, attributes and first/last seen information | context_get_entity |
| Entity neighborhood | Evidence-ranked one-hop relationships | context_entity_neighborhood |
| Incident summary | Blast radius, owners and recent changes, with evidence | context_incident_summary |
All four require a token with context:read. The API derives the organization from that token rather than accepting a client-supplied organization ID. Agent access follows the same read-only, organization-scoped boundary.
An investigation agent can follow a repeatable path through the evidence. It can resolve an entity and inspect its relationships, then retrieve incident context and follow the supporting records. Reading the underlying logs and metrics requires their corresponding read scopes. I keep that distinction explicit because permission to traverse relationships should not silently grant access to every signal those relationships reference.
Log management needs searchable retention and a verifiable audit trail
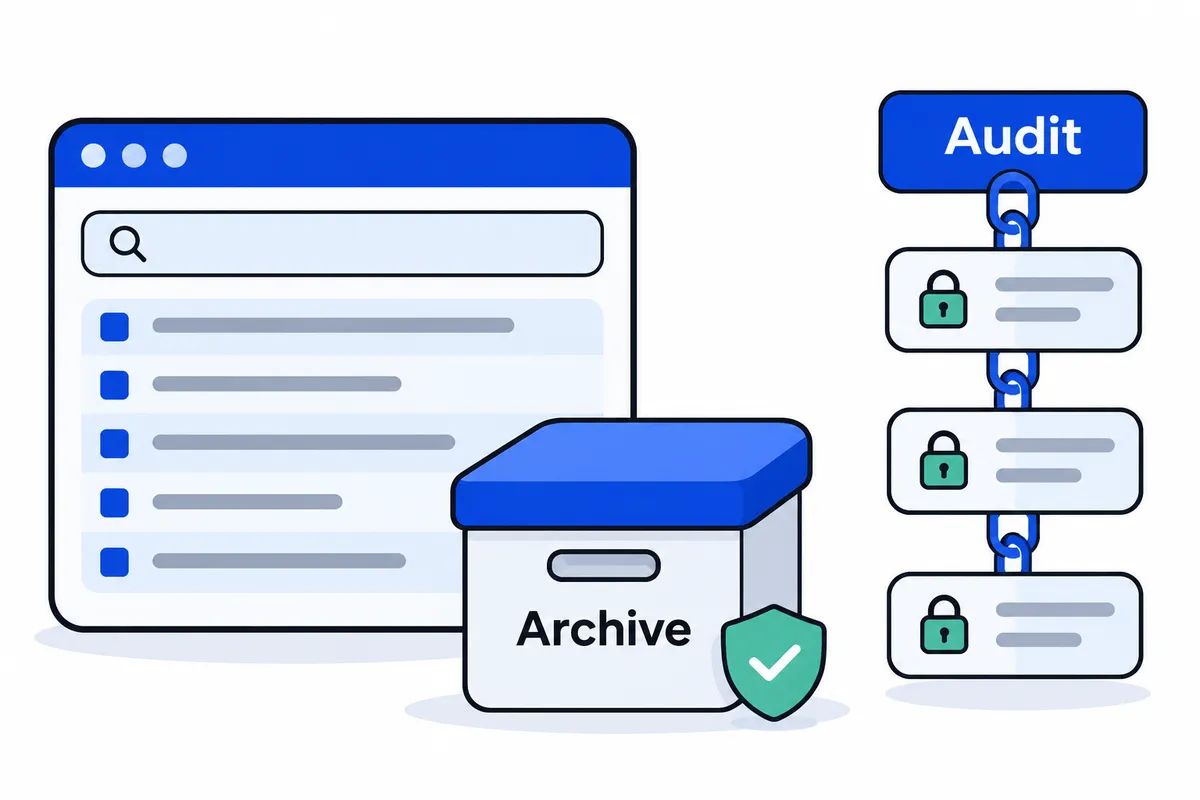
I evaluate log management by what an operator can do after ingestion. I need to find an event, check whether it repeats, watch what happens next, and turn a useful search into something that keeps watching.
Keeping records creates obligations inside the product. I need to explain where older records go, how an organization’s data stays isolated, what gets redacted, and what deletion actually removes. I evaluate searchability and data handling together because operators need answers to both.
Start with ingestion, then make the records usable
24Observe accepts JSON, NDJSON, OpenTelemetry OTLP and syslog sources. Applications can send logs over OTLP without a vendor-specific SDK. The Linux Sensor sends journald logs and host metrics. For sources that do not need a collector, HTTP ingestion provides another path.
Once records arrive, operators can search with structured KQL-lite filters, text matching, regex and level filters. Field filters, grouping and aggregation let me investigate beyond finding a matching string.
Every JSON key automatically becomes a clickable filter facet, with no schema declaration required before I can use that field in search.
When I investigate an unfamiliar event format, I can inspect the fields present in the record and narrow the results from there. I do not have to maintain a separate search schema first. The record’s structure becomes part of how I investigate it.
Carry the same question through search, charts and alerts
Search, saved charts, alerts and detection rules use the same query language. Live tail uses that syntax too. I can filter incoming events to a service or request ID, then move into historical investigation by changing the time range and keeping the filter syntax.
That removes a translation step. Once a search expresses the condition I need, I can chart it or watch for its return without rewriting it in another language.
The next step depends on what I need to investigate:
| Investigation need | Log-management capability |
|---|---|
| Follow matching events as they arrive | Filtered live tail |
| Find repeated message shapes | Pattern grouping |
| Count and trend recurring exceptions | Error grouping |
| Track a useful query over time | Saved-search time-series metrics |
| Detect a change from normal activity | Anomaly and spike alerts |
Pattern grouping normalizes variable values such as UUIDs, IP addresses, numbers and timestamps. Similar lines collapse into templates with counts, samples and dominant levels. I can see which message patterns repeat even when the individual records look different.
Error tracking handles repetition in stack traces. It fingerprints them and groups recurring exceptions so they can be counted and trended. Supported formats include JavaScript, Python, Java and Go. Operators can also resolve or ignore error groups.
Any saved search can become a chartable time series, go onto a board and be used for alerts. Anomaly alerts compare a current window against a rolling baseline. I can take the question from “what happened?” to “is this happening unusually often?” using the same query language throughout.
Keep older records searchable, with the storage dependency explicit
Recent log data stays in hot storage. Older data moves into a searchable cold archive, and searching that archive depends on the storage configuration.
Searching archived data older than seven days requires the relevant cold-tier object-storage credentials to be configured on the server. I would verify those credentials before depending on the archive for an investigation. The seven-day boundary describes storage access; it does not set a universal retention policy.
I also prefer investigations scoped by time and fields. 24Observe guides searches toward narrower windows and filters rather than full-table scans across months. Keeping records available is one operational responsibility. Choosing a sensible query scope is another.
With the required storage access configured, an operator can investigate older records in the searchable archive. The organization still needs to decide which records it must keep and for how long. I do not prescribe a fixed retention period for every environment.
Redact before storage, and earlier where possible
I do not want retention to become a reason to accumulate credentials. Log redaction runs by default before storage. On Sensor-equipped hosts, matching secrets are stripped before logs leave the machine. All incoming logs are scanned again at ingestion, including records from sources without the Sensor.
Default patterns cover bearer tokens, web tokens, cloud and provider keys, private keys, URL credentials and key=value secrets. Organizations can add custom patterns for internal token formats and identifiers.
I treat custom patterns as part of ingestion setup. Default matching cannot describe every internal format an organization may put into a log. I would review representative events and define the additional patterns before deciding what should enter retained storage.
Separate retention, isolation and real deletion
Retention determines what remains available over time. Deletion removes data, and moving a record into cold storage leaves it retained. I keep those distinctions explicit when reviewing how the product handles records.
24Observe filters each organization’s data on every query. That tenant boundary applies to reads. It describes a technical isolation capability and makes no claim about regulatory status.
Deleting an organization erases its data across stores. A deletion ledger retries failures, keeping a failed store operation tracked for another attempt. It does not silently treat that failure as completion. I want deletion accounted for across the storage system, with removal from the interface alone leaving that work unfinished.
The audit trail records who changed what, and when. Account-mutating actions record the actor, resource and timestamp, including creation, updates, deletion, role changes and secret rotation. The audit log is hash-chained, providing linked integrity evidence for its records.
Organizations can review and export their audit logs. The audit-log API supports filtering by action, user, personal access token and date range, with CSV export. A forward-cursor NDJSON export also supports downstream collection.
When I examine how the product helps meet a retention policy, I check whether retained records remain searchable, whether audit logs can be exported, what integrity evidence the hash-chained trail provides, and whether deletion follows through across stores. Each capability answers a specific operational question. The organization still owns the policy decisions about which records to retain and for how long.
How to start with one Linux sensor, hosted or self-hosted
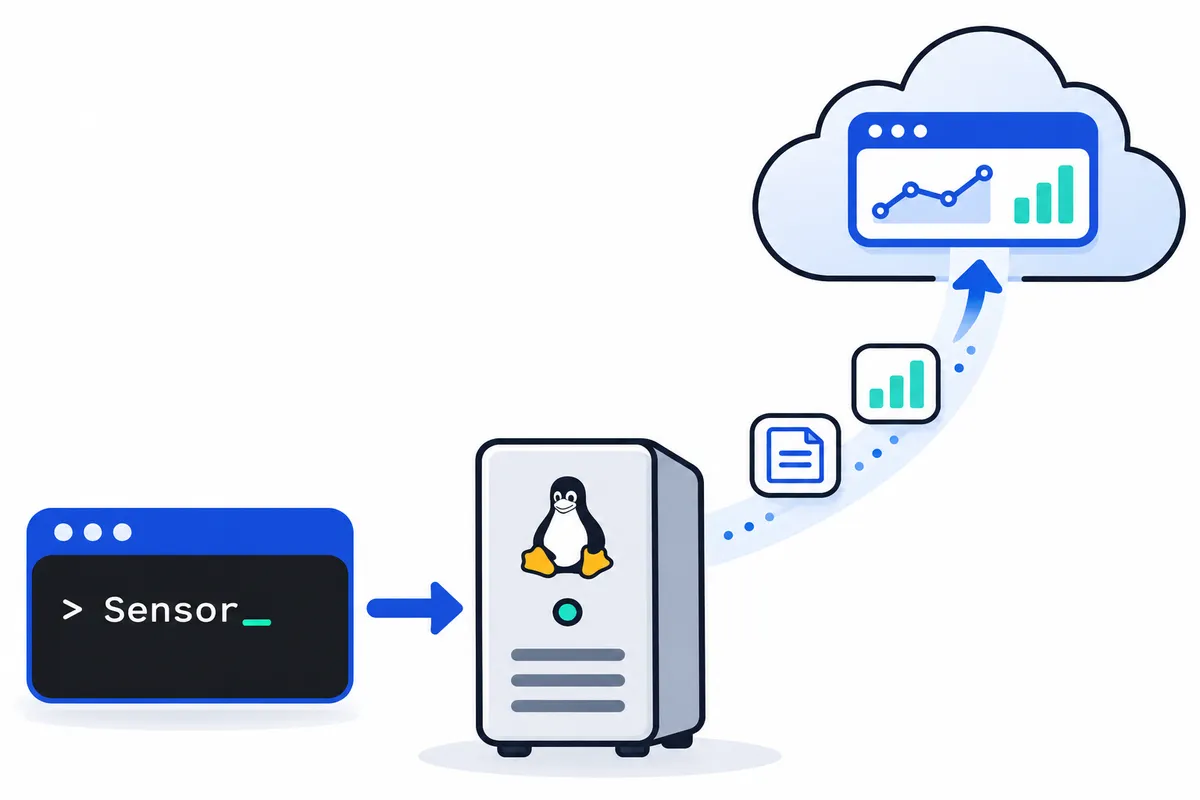
I recommend starting with one Linux host you administer and one service you want to monitor. That gives you a bounded evaluation: can you see the host’s logs and metrics, check the service, and receive a notification where you expect it?
Follow the quickstart and verify each step before adding more sources. You can answer those questions without moving every workload. I want the first installation to prove the collection and notification paths so you can identify which part needs attention before a larger rollout.
Start with collection, then prove delivery
-
Create an organization. An organization contains its own data, team and settings. The first person becomes its owner, with control over membership, billing and sensitive settings. Create the organization you intend to evaluate before generating installation credentials.
-
Generate the Linux installation command. Open Settings → Linux Hosts and use the command generated there. I have left the shell command out of this section. Use the installation instructions attached to your organization, and keep credentials from other environments out of the installation.
-
Run that command as root on the Linux host. The Sensor installs from a signed package and self-enrolls using a per-host token. The host needs outbound network access to the API endpoint. If the dashboard is empty, check that network path before investigating collection.
-
Verify arriving logs and host metrics. Confirm that both are arriving from the machine you enrolled. Search for that host’s events and use live tail to watch incoming records. If search looks empty, check the selected time range: a narrow window can hide events that have already arrived. Check metrics separately. Arriving logs only prove that the log path is working.
-
Create a monitor. Start with a URL, port or certificate check relevant to the service you selected. Inspect its recent check results so you know what the monitor is observing. Host telemetry and a service check answer different questions; I want both present in the initial evaluation.
-
Configure a notification channel and route. Choose a supported destination, such as email or Slack, and configure the routing that should deliver notifications there. An alert channel without a route delivers no notifications, so saving the destination alone leaves this step unfinished.
-
Test delivery. Send a test alert from the monitor and inspect the result for every configured channel. The test reports pass or fail, including the exact error. Confirm receipt at the destination before expanding the installation.
With this sequence, you can verify collection, service checks and delivery independently. A failure gives you a specific part of the setup to investigate.
Know what the Sensor installs and authenticates
Before rollout, understand how the signed package and per-host enrollment work. Each host enrolls with its own token. Re-running the installation command rotates that host token, so a rerun is a credential change with authentication consequences.
The Sensor also enables edge redaction. Matching secrets are stripped before logs leave the machine. I want that control at the collection point, where the original record exists. Processing after transmission should not be the only place that control happens.
Verify the Sensor and monitor separately: the Sensor collects system logs and host metrics, while the monitor checks the service you configured.
Keep existing OpenTelemetry instrumentation
If your applications or collectors already export OpenTelemetry, you can start there. Change the export destination to 24Observe without changing application code.
For gRPC exporters, use the supported OpenTelemetry collector bridge. Follow the collector documentation for the current configuration. Check the documented protocol and encoding support before sending directly to the API.
The collector can hold the 24Observe credential and add it on the outbound hop. Applications then do not need that token, and you can rotate the collector credential centrally. Traces can also be ingested as a signal that feeds the context graph.
Choose who operates the platform
Hosted onboarding avoids deploying the platform infrastructure yourself. The hosted SaaS currently runs in one region. I would make that part of the deployment decision before sending telemetry.
The documented self-hosted options use Docker Compose:
| Path | Deployment |
|---|---|
| Hosted | Create an organization and connect your sources without deploying the platform stack. |
| Full-stack self-hosted | Run everything on one Linux host, with no external services required. |
| Managed-Postgres self-hosted | Retain the rest of the stack while using Postgres 16 or later instead of bundled Postgres. |
The self-hosting guide documents both Compose paths. Self-hosting requires Linux, Docker Engine 20 or later, and Compose v2. You take responsibility for operating the infrastructure, managing secrets and monitoring disk usage. Watch storage growth, including the check-results table. With managed Postgres, the remaining services are still your responsibility.
Pick the entry option deliberately
The free tier requires no credit card and supports ingestion, search, detections and the AI analyst. The 14-day trial is a separate entry option and also requires no card. Choose the option that fits your evaluation. With either option, I would complete the host, monitor and notification checks before adding the next source.
An observability platform should work through an API and MCP
I want an engineer, a deployment script and an AI assistant to work against the same operational records. If each needs a different integration with a different view of an incident, I have recreated the tool sprawl I built 24Observe to remove. The interface can change while the incident, evidence and permission boundaries stay consistent.
24Observe exposes REST and MCP interfaces for that reason. Engineers can inspect requests directly, scripts can provision monitoring, and connected assistants can investigate live telemetry. All use the platform’s shared data and incidents without maintaining another operational copy.
REST that engineers can inspect and generate clients from
The HTTPS REST API uses bearer-token authentication, with JSON requests and responses. No client library is required. I want an engineer to be able to inspect a request and understand the response without first learning a vendor SDK.
The API reference documents authentication, scopes, errors and rate limits. An interactive OpenAPI 3.1 specification exposes endpoint schemas and try-it-now requests. The machine-readable specification can generate typed clients in Python, TypeScript or Go, so automation can work from declared request and response shapes.
Hosted and self-hosted deployments expose identical REST and MCP APIs. A self-hosted deployment uses its own host, with the same automation model.
For developers building agents directly, we also provide pre-converted tool definitions for OpenAI, Anthropic and LangChain. The agent API documentation covers scoped tokens, rate-limit headers, signed webhooks and idempotency.
A backend API and an assistant need different boundaries
I keep the complete raw API separate from the curated MCP tool surface.
The raw API is for trusted backend automation, including deployment pipelines, scheduled jobs and chatops bots. These systems may need broader operations. Their tokens still need the relevant permissions.
MCP exposes an explicit tool allowlist. It proxies read operations and a curated selection of write operations, excluding DELETE, authentication and billing operations from the complete administrative API. An operation must be on the allowlist, and the token must authorize it.
Within their granted scopes, connected assistants can:
| Investigation task | Available access |
|---|---|
| Examine logs | Search and live tail |
| Check measurements | Read metrics |
| Inspect an incident | List incidents, inspect details and read analyst verdicts |
| Follow operational relationships | Traverse the read-only, organization-scoped context graph |
Write capabilities require appropriate scopes. An authorized assistant can create or adjust monitors, acknowledge or resolve incidents, and manage detections. A read-only token cannot change platform data or settings.
The MCP documentation explains these boundaries and how to run the server. It is currently available by self-hosting from source: build it, then configure Node to run the built entry point. The managed @observe24/mcp package is forthcoming and has not been published yet.
Tokens should limit authority and consumption
24Observe has 24 token scopes. Every API request must satisfy both the user’s role permissions and the personal access token’s scopes. A token cannot expand its owner’s authority.
Read permissions for logs, incidents, metrics and context can be granted separately. I can give an assistant access to incident details without granting log access. Graph traversal requires context:read and remains read-only.
Tokens also support configurable daily mutation budgets and log-ingestion byte limits. Both are per-token controls. Mutation budgets count successful responses and reset at midnight UTC. An exhausted budget returns HTTP 429.
Token plaintext is displayed once, at creation. We store its SHA-256 hash rather than recoverable plaintext.
I recommend a separate, narrowly scoped token for each assistant or automation. Revoking one token cuts off that integration without disturbing the others, while preserving its existing audit trail.
Retries and event delivery need explicit behavior
I expect automation to retry, so the API needs to handle repeated requests deliberately.
Every mutating endpoint accepts an Idempotency-Key. Repeating the same request with the same key returns the cached response without executing the mutation again. Reusing that key with a different body returns HTTP 409. Responses are cached per token and key for 24 hours.
Signed event webhooks let external systems react to incident opening, incident resolution and monitor status changes. Deliveries use HMAC-SHA256 signatures, with retries and delivery logs available for inspection.
Every mutation is recorded in a PAT-attributed audit log that can be exported as CSV. Every MCP tool call is also audited and attributed to its token, so an operator can distinguish an assistant’s actions from another integration’s actions.
AI-agent security is a separate capability
Connecting an assistant to telemetry and observing the assistant’s own tool use are separate concerns.
Our AI-agent security capability audits MCP tool calls and provides a prompt-injection and data-leak shield. It also provides LLM latency and token analytics, along with tool-call execution sandboxing for Claude, Cursor and other agents.
I would start a connected assistant with only the read scopes its investigation needs. Write access can be added through a new token with specific write scopes. The operator then has an explicit permission change to review and an audit trail to inspect.
Observability platform pricing should make growth understandable
I want an operator to understand what changes the bill before connecting another source. Replacing separate monitoring, log and security tools with one platform should make the budget easier to explain.
That is why I explain 24Observe through its actual meters and limits. You can compare your workload with the allowances and work out what fits, without relying on a claimed savings percentage.
Separate usage meters from capacity ceilings
24Observe meters log volume and AI investigations. It does not charge per host or per seat.
The monthly log-volume allowance is shared across logs, metrics and ingested traces. Count those signals together when estimating volume. Budgeting only for application log files would leave part of the workload out of your estimate.
Endpoints work differently. Where a plan has a connected-endpoint ceiling, that count combines:
- Linux Sensor hosts.
- Monitored AI agents.
- Universal-ingest sources.
Where limits apply, those categories share one endpoint quota. Each category draws from the same pool.
An endpoint limit sets capacity. Connecting another endpoint within your allowance does not introduce a per-host or per-agent charge. You still need to account for the telemetry it sends and the investigations your incidents generate. When planning growth, check endpoint capacity separately from telemetry volume and investigation usage.
The plan figures I can state consistently
| Plan | Monthly price | Monitors | Endpoint ceiling | Monthly log-volume allowance* | AI investigations |
|---|---|---|---|---|---|
| Free | Free | 25 | 5 | 1 GB | 10 |
| Team | $29 | 100 | 50 | 25 GB | 250 |
| Business | $99 | 500 | 300 | 150 GB | 1,500 |
The log-volume allowance is shared across logs, metrics and ingested traces.
Scale is $299 per month. I have left its monitor and log allowances out of this table because the supplied listings conflict. Combining figures from those listings would describe a plan that neither source actually offers. Check current pricing when evaluating a purchase.
What an AI investigation counts
An investigation triages one incident. The analyst retrieves its blast radius from the context graph, searches relevant logs and returns an evidence-cited verdict. Budget for investigations based on incident triage activity rather than endpoint count.
Reopening an incident can trigger another investigation. A monthly estimate based only on distinct incident records can therefore understate usage. If your workflow includes reopening incidents for further analysis, allow for those additional investigations when comparing your estimate with a plan.
Ordinary log searches are not charged through a per-query intelligence meter. You can search the evidence yourself without treating each search as an analyst investigation. Those are separate activities in this pricing model.
Features stay shared across plans
Every plan includes uptime monitoring, logs, the full SIEM and the AI SOC analyst. Plans change capacity and allowances. Access to the SIEM does not require a separate security tier.
You can evaluate the shared workflow on Free before choosing more capacity. That gives you a way to assess monitoring alongside detection and investigation without buying access to each capability separately.
Paid plans cover fully managed hosting, operations and support. There is no contact-sales tier, no per-seat multiplier and no hidden data-transfer line item. I would use those billing terms to compare plans against your workload; they cannot tell you what your organization will save.
Growth should not require an annual bet
Annual commitments are optional. You can upgrade or downgrade at any time, with changes prorated to the hour.
When I evaluate a plan, I check monitor requirements and the combined endpoint count first. I also check monthly telemetry volume and expected investigation activity. Each answers a different capacity question, so a comfortable endpoint allowance alone does not establish whether the volume or investigation allowance fits.
Editorial check before publication: Reconcile the conflicting Scale monitor and log quotas and the check-interval listings across the supplied material. Keep those allowances and intervals out of the published comparison until they agree. Do not assemble a new plan from conflicting figures.
How one observability platform compares with separate NOC and SOC tools
I compare the work involved in buying and running these tools. Each product below has a specialist job it does best. My decision came down to the operational cost of keeping those jobs in separate products.
Prometheus for metrics, Grafana for dashboards, separate uptime monitoring, observability, a SIEM, a NOC wallboard and an AI analyst can each make sense individually. Running seven tools means maintaining their alerts, logins and separate views of the same incident. When evaluating 24Observe, I would look at how much of that coordination I still had to do myself:
| Search or buying question | Separate product’s specialist role | What I built into 24Observe | Boundary to state |
|---|---|---|---|
| Datadog alternative | Datadog: application monitoring and telemetry analysis | Uptime, logs, metrics, ingested traces, SIEM and shared incidents | No APM, distributed tracing or RUM |
| Splunk alternative | Splunk: log search and security analytics | Search, live tail, detections, cases and retained logs in one workflow | Not a claim of query-language or application parity |
| PagerDuty alternative | PagerDuty: on-call incident response | Incident routing, acknowledgment, escalation and recovery-driven closure | PagerDuty can remain connected; paging support differs for monitor and log alerts |
| Log management tool | A specialist log product: dedicated log workflows | Ingestion, search, patterns, alerts, retention and incident context | Volume allowances and archive configuration still matter |
| AI SOC analyst | A specialist analyst product: investigation workflows | Opt-in, evidence-cited investigation using shared incident context | Read-only investigation; remediation requires approval |
| Prometheus and Grafana | Prometheus: metrics collection; Grafana: dashboards | Shared operational workflows around telemetry and incidents | Self-hosted 24Observe also bundles these components |
Evaluate the handoffs, including the boundaries
I built monitoring, observability and SIEM around one data store and one set of incidents. The context graph connects hosts, users, IP addresses and incidents. Ingested traces feed that graph as another signal. 24Observe does not provide APM, distributed tracing or real user monitoring.
During an evaluation, I would follow an incident from detection through acknowledgment, investigation and closure. Check whether the evidence stays connected as responsibility moves between NOC and SOC. Security cases can group incidents across detections and correlations while tracking status, severity, assignee, notes and disposition.
Test paging separately for monitor checks and log alerts. Monitor checks support PagerDuty and Opsgenie routing, including closure when the monitor recovers. PagerDuty, Opsgenie, SMS and voice routing remain on the roadmap for log alerts, so delivery support differs by alert source even though they share an incident model.
The AI analyst requires organization-level opt-in. It investigates with read-only tools and returns cited evidence. Proposed remediation requires human approval; the analyst never executes it automatically.
For logs, test the searches you actually use. Search, live tail, pattern grouping and retained logs are supported. I make no claim of query-language parity with another product. Review volume allowances and cold-storage configuration against your retention policy.
Consolidation can coexist with existing systems
You can keep existing tools when using 24Observe. Existing OpenTelemetry collectors can send telemetry to it. PagerDuty can remain your paging destination for supported monitor workflows, and an exportable audit trail can feed Splunk or another downstream SIEM.
The self-hosted deployment also bundles Prometheus, Grafana and Loki. I chose to build shared operational workflows around those specialist components.
To give the buying decision a concrete scope, I would document which workflows stay where and who owns each handoff, then identify the alert paths that need testing. I would make that evaluation without assuming competitor prices or promising wholesale replacement.
Who needs shared NOC and SOC tools, AI SRE and an AI SOC analyst?
I organize the audience by the work they need to perform. A job title alone tells me little about whether 24Observe fits.
I look at whether availability, infrastructure and security investigations need the same evidence. If your operators keep moving between separate tools to understand the same host, user or IP address, shared context deserves an evaluation. I built 24Observe around one data store, one set of incidents and a context graph connecting that evidence.
Start with the workflow you need to evaluate
| Role | Relevant workflow | First evaluation task |
|---|---|---|
| NOC operators | Inspect check failures, route incidents through on-call schedules, schedule maintenance and communicate service status. | Create a check against a test endpoint, inspect a failure, test its notification route and post a public incident update. |
| SRE and DevOps engineers | Search logs, inspect host metrics, open threshold incidents and use context for evidence-led investigation. | Send telemetry from a test Linux host, configure a metric threshold and compare the investigation’s citations with the underlying logs and metrics. |
| SOC analysts | Investigate normalized security events using seeded detections, correlations, cases and cited verdicts. | Send synthetic authentication events, inspect the normalized fields and review a detection incident’s evidence and disposition. |
| AI teams | Inspect tool calls, grant scoped telemetry access and evaluate AI-agent security controls. | Give an assistant a read-only token, query an incident through MCP and inspect the token-attributed tool-call audit trail. |
I suggest these tasks for evaluation without promising outcomes. I want an operator to inspect what happened at each step, including missing telemetry, an incorrect route or evidence that does not support a confident verdict.
For the NOC, I would test maintenance behavior alongside failure detection. Maintenance windows keep checks running while pausing alerts. Status communication has its own workflow: incident timelines support public updates, and status pages let readers follow service conditions.
For SRE and DevOps work, threshold incidents can cover CPU, memory, disk, load and request latency. I would follow an incident into the context graph, then open the supporting telemetry. A relationship in the graph should guide the investigation. The underlying evidence still needs checking.
For SOC work, new organizations receive seeded detection packs and Sigma rules. Correlations connect multiple events, while cases track investigation status, severity, assignee, notes and disposition. My evaluation would include reviewing the AI SOC analyst’s cited verdict, confidence and recommended actions. Proposed remediation requires human approval.
AI teams should test the access boundaries. AI-agent security includes MCP tool-call auditing, a prompt-injection and data-leak shield, tool-call execution sandboxing, and LLM latency and token analytics. Telemetry access can be scoped separately for logs, incidents, metrics and context. Test those permissions deliberately, including requests the assistant should not be allowed to make.
Students can evaluate the same investigation discipline
I founded Networkers Home in 2007. For students, I connect these workflows to its AI SOC Analyst course and Cybersecurity course as related learning paths.
The Cybersecurity curriculum describes a 49-scenario 24Observe lab block covering real device logs, normalization, detection, AI triage and incident disposition. That curriculum reference is separate from my evaluation suggestion here. It carries no promise of platform access, a particular lab provision or an employment outcome.
You can also evaluate with synthetic data. The documented telemetry test guide describes AI-generated synthetic telemetry for checking detections, metric alerts and AI triage. I would keep the expected events beside the resulting evidence and record any gaps.
A clear non-fit
If you require a current APM, distributed tracing or real user monitoring product, 24Observe does not fit that requirement. It ingests traces as a telemetry signal that feeds the context graph. Evaluate its shared NOC, SOC and investigation workflows without treating trace ingestion as a substitute for those product categories.
What comes next for 24Observe, and what you can evaluate now
I keep current capabilities separate from documented future work. Evaluate 24Observe on what you can run today.
Gauge and Sum counter metrics are currently ingested. Histogram and Summary metric points are acknowledged but skipped, with that omission reported in the OTLP partialSuccess response. Full histogram support is on the roadmap. If your evaluation depends on those points, inspect the response to confirm what was ingested. Acknowledgment alone does not tell you that.
You can currently build and self-host the MCP server from source. The managed @observe24/mcp package is forthcoming and has not been published. I am giving neither roadmap item a release date here.
Evaluate the workflow with your own evidence
Start with the quickstart and review pricing. If you want to run the platform on your infrastructure, use the self-hosting guide. A hosted free trial is also available.
I would evaluate it in this order:
- Send representative telemetry, using data that reflects the systems you actually investigate.
- Create a check for an endpoint you operate.
- Enable a relevant detection and make sure you are sending the events it needs.
- Inspect an incident and its context. Follow the evidence links back to the underlying records.
- Opt in to LLM use only if your organization chooses. LLM use requires organization-level opt-in.
Every quickstart step has an API equivalent. My recommendation is to compare the shared evidence and incident workflow against the separate tools you already run, using your own telemetry and investigation process.
Frequently asked questions
Is 24Observe a Datadog alternative?
I built 24Observe as an option for teams evaluating a Datadog alternative around uptime, logs, metrics, security detections and shared incident investigation. Datadog is best at application monitoring and telemetry analysis. The boundary matters: 24Observe does not currently offer APM, distributed tracing or real user monitoring. It ingests traces as a signal feeding the context graph. I would compare the operational workflows you need rather than assume feature-for-feature replacement.
Can I use 24Observe as a Splunk alternative?
For teams searching for a Splunk alternative, I would start with log ingestion, search, detections, retention and investigation requirements. Splunk is best at log search and security analytics. 24Observe combines structured search, live tail, pattern grouping, anomaly alerts and SIEM detections with shared incidents. It also provides export paths for downstream systems. I would validate required queries, sources and retention settings before treating either product as interchangeable.
Is 24Observe a PagerDuty alternative, or does it integrate with PagerDuty?
Both are evaluation paths, depending on your workflow. PagerDuty is best at on-call incident response, and 24Observe supports PagerDuty paging alongside its own incident workflow. When a monitored service recovers, 24Observe sends a resolve event so PagerDuty can close the incident. Incident emails also support one-tap acknowledgment and resolution. The current limitation is important: PagerDuty routing supports monitor checks but remains on the roadmap for log alerts.
What should I test when choosing a log management tool?
I would test the complete investigation path: ingest representative events, find them with field filters, follow a live stream, group recurring patterns and turn a saved search into an alertable metric. In 24Observe, search, charts, alerts and detections use the same query language. I would also verify archive access, redaction, export and deletion behavior. A log management tool needs to fit both daily troubleshooting and your retention policy.
What does the AI SOC analyst do, and can it change my systems?
The AI SOC analyst investigates incidents and returns evidence-cited findings, confidence, disposition, affected resources and recommended actions. LLM use requires organization-level opt-in, and organizations can bring their own LLM key. The analyst uses read-only investigation tools to query logs, read metrics and traverse context. It cannot change systems during an investigation. Proposed actions such as blocking, isolation or rollback require human approval and execution.
Is 24Observe an open source SIEM or a self-hosted SIEM tool?
I can substantiate that 24Observe has a fully self-hostable distribution and a public repository identified in the self-hosting documentation. You can run the platform on your own infrastructure, with the same capabilities as the managed service. I would not infer an open source license merely from repository availability. If your requirement specifically says open source SIEM, review the repository's license as well as the deployment instructions.
Does the SIEM tool include Sigma rules and prebuilt detections?
Yes. New organizations receive seeded detection packs and Sigma rules on day one. The platform includes 87 prebuilt detections across 14 packs, plus custom detections and multi-event correlation. I keep that inventory separate from the Sigma rule count because the supplied facts do not equate them. Packs are telemetry-gated: authentication detections, for example, need relevant authentication events before they can identify matching activity.
How does log retention help meet a compliance retention policy?
24Observe keeps recent logs in hot storage and supports searchable older archives. It also provides an exportable, hash-chained audit trail, organization-scoped reads and organization deletion across stores, with a ledger that retries deletion failures. These capabilities help meet a retention policy; they do not establish certification or legal sufficiency. I would verify archive credentials, required retention periods and deletion procedures against the organization's own policy before deployment.