Context Graph · 24Observe
Context Graph Explained: Entities, Evidence and Incident Investigation
Swipe sideways to see the whole diagram.
What is a context graph in incident investigation?
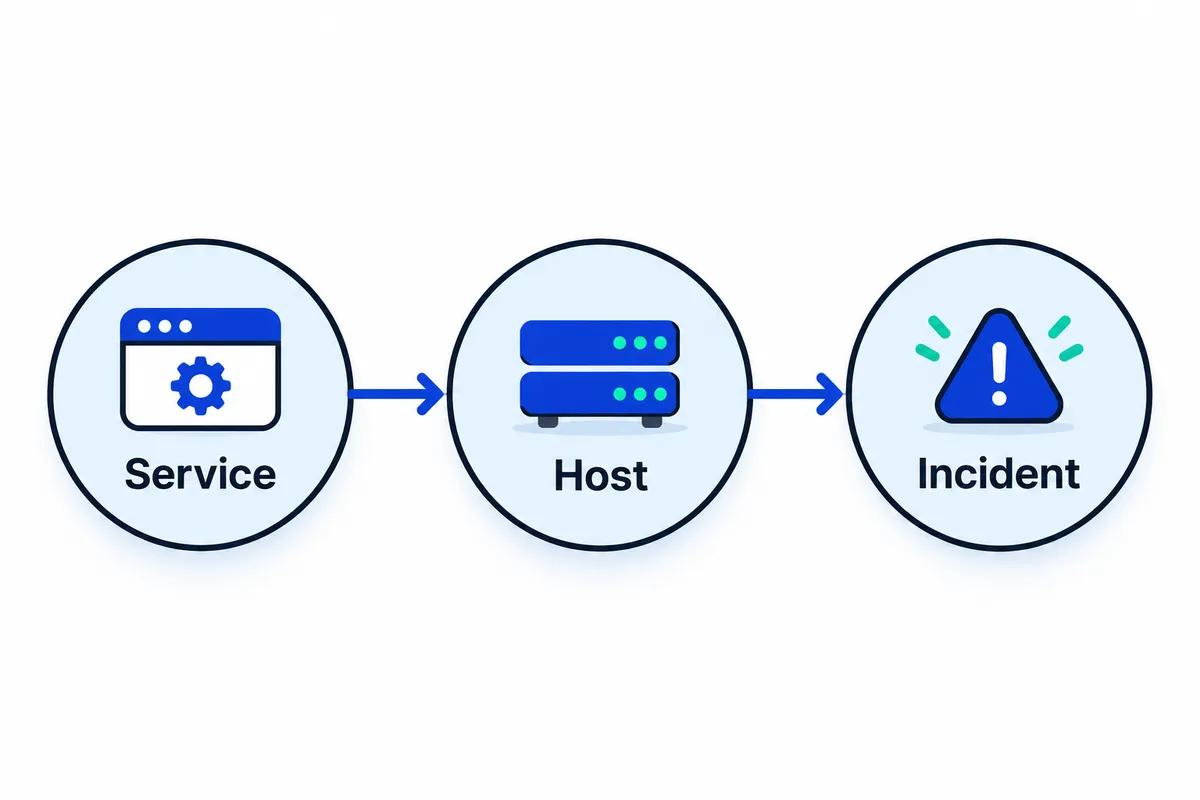
An operational context graph represents entities and their relationships. Investigators use it to connect an alert to the relevant systems, identities, teams responsible for them and records that support those connections.
We use context graph here to describe that operational investigation model. The term has other uses in enterprise search, AI workflows and data platforms, with a scope that varies by setting. This definition applies to the investigation model discussed in this article.
24Observe is built by the Networkers Home group, so weigh our view accordingly. It offers an example of this model: a read-only operational graph constructed from telemetry and inventory data. The Context Layer documentation explains how it represents entities and relationships in each organization’s graph. You can understand the underlying approach without using a particular product.
What do nodes, edges, attributes and evidence mean?
Consider a checkout incident in which requests start failing. Checkout calls a payment service, runs on an application host and uses a service identity. A named team owns the checkout service.
| Graph element | Meaning | Checkout example |
|---|---|---|
| Node | An identifiable entity under investigation | Checkout service, application host, service identity, owning team or incident |
| Directional edge | A typed connection from one entity to another | Checkout calls payment; checkout runs on the host; the team owns checkout |
| Attribute | A property describing an entity or connection | Environment, hostname, criticality or when a relationship was last observed |
| Evidence | A record supporting a connection or observation | A request span showing the call, a host log identifying the service or an ownership record |
The direction of a connection matters: “checkout calls payment” and “payment calls checkout” describe different relationships. Ownership answers whom the investigator should involve. Call relationships describe where requests travel.
Investigators need evidence to check those connections. A log record may show that a process was running on a host at a given time. That record alone cannot establish that the host caused checkout to fail. The entity concepts guide explains the product-specific terminology in more detail.
Is the graph the picture, the model or the database?
The graph representation is a model of entities, typed relationships, their direction and associated properties. A diagram with nodes and connecting lines is one way to display it. The same relationships can appear in a table, query result or incident summary without a diagram.
Storage is a separate implementation decision. Using a graph model does not require any particular graph database. An implementation may store connections directly or derive them from other sources.
The model should expose enough information to answer practical investigation questions:
- For a SOC analyst, which identity touched the affected host, and what evidence supports that connection?
- For a NOC engineer, which services depend on the device that is failing?
- For an SRE, do the failing requests share a dependency, and who owns it?
These relationships help investigators move between observations. At each step, the supporting records determine what a connection actually establishes. See the observability explainer for related reading.
How does 24Observe use a context graph?
24Observe is built by the Networkers Home group, so weigh our view accordingly. We put it first because its documented entity model, relationship evidence and investigation interfaces give us a concrete example to examine. That choice makes no claim about category leadership.
The founder’s account of building the platform describes the motivation: reducing the complexity of operating separate monitoring, observability, security and investigation tools.
A shared foundation, with distinct graph roles
24Observe brings uptime and browser checks together with logs, metrics, trace inputs and SIEM detection. Its monitoring, observability and security functions share a data store and incident set. The platform concepts explain how those signals support investigations.
The documentation describes two graph roles:
- The operational context graph represents services, hosts, devices, identities, incidents, assets, owners and AI agents, along with their relationships. It derives this operational picture from telemetry and inventory.
- The entity graph connects hosts, user identities and IP addresses across incidents. It associates the entities implicated in activity with incident records.
These roles describe how the graphs support investigation. They do not establish whether the product uses separate graph databases, tables or another internal storage arrangement.
The context graph overview describes automatic relationship discovery. Trace inputs contribute caller-to-callee relationships that become service dependency edges. Traces feed the context graph as operational context and supporting evidence. This does not position 24Observe as an APM, distributed tracing or RUM product.
Worked example: investigating a service incident
This illustrative walkthrough uses documented capabilities. It describes neither a customer incident nor an independently measured result.
Suppose supplied telemetry and inventory identify checkout-api calling payment-api, with payment-api running on app-02. A latency alert then opens an incident.
The context graph gives the investigator relationships to examine: the affected service, its connected dependencies, the implicated host and ownership information. Available operational inputs supply these connections, without requiring an analyst to draw a diagram during the incident.
Investigators can inspect the evidence behind each relationship. According to the context documentation, relationships include confidence, evidence and recency metadata. Evidence links lead to the particular trace, log entry, incident or audit event supporting a connection. An investigator examining a service dependency can follow those links back to the observation behind it.
The AI analyst can inspect that context, retrieve metrics and related logs, and examine recent changes. An engineer can also use log search to test the explanation against surrounding events. A connected host is a candidate for investigation; establishing whether it caused the latency requires further evidence.
If another incident implicates an identity or IP address, the entity graph provides a way to connect that activity across incidents. The service dependency shows which service calls another. The entity association helps investigators identify which entities recur across incidents.
Organization-scoped, read-only investigation access
The operational graph belongs to each organization’s context. The context API obtains that organization from the access token; clients cannot select another organization by submitting its identifier.
Context access is read-only and requires context:read, as documented in the API reference. Permission to inspect dependencies does not itself authorize remediation.
Through REST and the MCP interface, investigators can resolve entity names, retrieve entity details, inspect neighboring relationships and request incident context. The agent cookbook explains how custom agents use the same topology available to the built-in analyst. Engineers and agents can use this evidence-linked investigation surface, while context access alone grants no change permissions.
How does the term context graph differ across AI and data platforms?
The term context graph covers several kinds of representation. We start with 24Observe because this article focuses on incident investigation. It is built by our group, Networkers Home, so weigh our view accordingly. To distinguish these uses, examine what each graph connects, the question it addresses and the evidence behind its answer.
| Meaning and attributed example | What the representation connects | Question it answers | Supporting evidence |
|---|---|---|---|
| Operational investigation: 24Observe | Services, hosts, incidents, assets, owners and AI agents, derived from telemetry and inventory | Which components and owners are relevant to this incident? | Existing telemetry and inventory, with relationships linked to supporting records |
| Workplace context: Glean | People, enterprise resources and work relationships, including ownership, approvals and collaboration | How does work move between people, teams and systems? | Timestamped activity, edits, approvals and recorded state transitions |
| Agent execution history: Beacon | Agent decision trajectories, configuration choices, surrounding conditions and subsequent results | Which recorded decision and circumstances explain this execution outcome? | Execution traces connecting choices with configuration, implementation stage, data conditions and results |
| Graph layer over existing data: PuppyGraph | Records across connected sources, exposed through a federated graph model without ETL | Which relationships can we query across these sources? | Source records and the graph model that defines their connections |
Architecture, memory and investigation are different concerns
PuppyGraph describes a data-access architecture in which queries reach existing sources through a graph layer. This can provide graph context for retrieval-augmented generation without copying the data elsewhere. The architecture alone does not establish a workflow for investigating incidents.
Beacon describes a representation whose structure develops from observed agent-execution trajectories. Its stated need to participate at the point where decisions are committed applies to that execution-derived approach. Other context graphs do not necessarily require access to the execution path. An operational graph, for example, can be built read-only from telemetry already collected.
Glean approaches the term through workplace processes. Its architecture treats connectors, retrieval indexes, relationship graphs and execution memory as separate components. Understanding a process requires both organizational structure and learned behavior, so the graph by itself cannot explain every workflow.
These approaches can overlap, but they serve different purposes. An investigator may use graph-reading agent tools through an interface provided by structured agent access. Those capabilities do not make the graph a store of execution history. The same distinction applies to operational relationships and an incident investigator: the relationships represent connections, while the investigator evaluates evidence.
Recorded behavior does not establish private intent
A graph may record an engineer disabling a setting before a failure. Without a recorded rationale, it cannot establish that person’s reasoning with certainty. Recurring patterns may suggest intent, but investigators must keep inferred explanations distinct from documented evidence.
Our security and observability explanation examines the related question of how shared telemetry serves different investigative purposes. Once these meanings have been distinguished, assess deployment models and product suitability separately rather than treating the shared term as evidence of equivalent capabilities.
Which entities and relationships belong in an operational entity graph?
Include entities that answer investigation questions: what failed, what depends on it, which identity acted, what changed and who should respond. When a graph contains names without these distinctions, analysts have to search for the missing context.
24Observe is built by the Networkers Home group, so weigh our view accordingly. It represents operational entities and their connections. Its operational concepts cover services, hosts, devices and identities. The documented context entity catalog also includes incidents, cases, assets, on-call people, AI agents, IOCs, changes and monitors. IP linking is documented separately: its entity graph connects hosts, users and IP addresses across incidents. Ownership is represented through edges.
Entity reference: what each entity should help answer
The evidence examples below are generic modeling guidance. They make no claims about supported connectors or 24Observe’s matching algorithm. Owners appear as an operational role, without assuming a separate owner node type.
| Entity or role | Operational question | Illustrative identity evidence |
|---|---|---|
| Service | Which application component is involved? | Service identifier qualified by environment and namespace |
| Host | Which machine produced the signal? | Cloud instance ID or enrolled host record |
| Device | Which router, switch or firewall is implicated? | Serial number or inventory identifier |
| User or other identity | Which person, service account or workload acted? | Identity-provider subject ID or workload principal |
| IP address | Which endpoint used this address during the incident? | Timestamped DHCP lease, interface record or connection event |
| Incident | Which triggering condition is being investigated? | Incident ID and opening event |
| Case | Which incidents belong to this investigation? | Case ID and incident-membership records |
| Asset | Which managed resource needs business or risk context? | Inventory ID and authoritative asset record |
| Owner | Who is accountable for maintaining this resource? | Ownership assignment in a service catalog or inventory |
| On-call person | Who should respond during this interval? | Schedule assignment and effective shift times |
| Change | What modification preceded the symptoms? | Deployment ID, commit reference or audit event ID |
| Indicator, or IOC | Which suspicious observable was matched? | Indicator value, type and intelligence-record reference |
| AI agent | Which automated actor participated? | Agent identifier and execution record |
| Monitor | Which check observed the failure? | Monitor ID and check configuration |
Keep assets separate from their observations. A server asset can persist as its hostname, address or operating state changes. An identity can also act through several hosts while remaining distinct from each host.
Relationships need verbs and direction
24Observe documents the relationship names below. The examples explain what each relationship means; they do not prescribe constraints on endpoint types.
| Relationship | Illustrative direction | Question answered |
|---|---|---|
calls | Service A → service B | Which service invokes another? |
runs_on | Service → host | Where does the service execute? |
impacts | Incident → service | What is affected? |
owns | Owner → asset | Who has maintenance accountability? |
responsible_for | On-call person → service | Who handles the response? |
changed | Change → asset | What resource was modified? |
matched | Incident → IOC | Which indicator was implicated? |
groups | Case → incident | Which investigation contains this incident? |
An edge’s direction determines its meaning. If checkout calls payments, reversing the edge changes the dependency question. Neither direction alone establishes that payments caused checkout’s failure.
Ownership and on-call responsibility answer different questions. The owning team retains maintenance accountability, while the responder may change with each shift. Represent both so a schedule change does not replace the ownership relationship.
Use canonical identifiers and time bounds
For entity design, choose a stable identifier with a defined scope over a display name. Retain aliases, source identifiers and validity intervals so investigators can tell whether a resource was renamed or replaced.
A reused IP address cannot establish permanent identity. DHCP reassignment, NAT and short-lived infrastructure can link the same address to different entities. Correlate it with other evidence within the relevant time window.
24Observe’s entity retrieval returns an ID, canonical key, attributes and first-seen and last-seen information. Use those documented fields to inspect identity without assuming they explain the matching algorithm. Where identity evidence is missing, record that uncertainty explicitly.
How is a context graph built from telemetry without hand-drawn maps?
A context graph starts with records your systems already produce. The construction pipeline identifies entities and reconciles their identifiers, then extracts supported relationships. It attaches evidence references and refreshes the resulting context as source information changes. Engineers do not need to draw each connection, though the source records must contain enough information to establish it.
24Observe is built by our group, so weigh our view accordingly. Its operational graph is read-only and draws on existing telemetry and inventory. The scheduled context engine processes spans, logs, monitor records, incidents, asset data, on-call information and audit activity.
Turn source records into identifiable entities
Start by extracting candidate entities such as services, hosts, identities, assets and incidents. Normalize their identifiers so records about the same component can be associated correctly.
A practical naming policy should distinguish a production checkout service from its staging counterpart. Stable host identifiers help avoid treating a renamed server as an unrelated machine. These examples describe data-quality responsibilities without specifying a particular matching algorithm.
Use this source-to-relationship checklist to assess whether your records contain usable context. Each relationship requires supporting fields. The source category alone cannot establish the connection.
| Source | Identifiers or context needed | Relationship it can support | Supporting reference |
|---|---|---|---|
| Logs | Service, host or identity identifiers, plus explicit activity | Associate an event with an entity; support service-to-host association when recorded | Original log record |
| Spans | Identifiable caller and callee services | Service A calls service B | Supporting span |
| Monitors | Monitor identifier and checked target | Associate a monitor with its target and resulting incident | Monitor configuration and check record |
| Incident records | Incident identifier and implicated entities | Incident affects a host, service or identity | Incident record |
| Inventory | Stable asset identifiers and ownership information | Asset belongs to an owner; enrich an entity with criticality | Inventory entry |
| On-call information | Person, responsibility assignment and relevant schedule | Person is responsible for an operational entity | Assignment or schedule record |
| Audit activity | Actor, action, target where recorded, and timestamp | Identity changed an operational entity | Audit entry |
Derive relationships, then retain their provenance
Recognizing an entity and discovering a dependency require different evidence. A log mentioning checkout establishes useful service context. That mention alone cannot establish which downstream service checkout calls.
In 24Observe, caller and callee information carried by spans supplies the observed service-to-service dependency links. These connections reflect recorded calls and require no manually declared dependency list. Traces feed the context graph with evidence for dependencies where the source records identify the services involved.
After extracting a relationship, retain a reference to its supporting record. 24Observe associates graph relationships with evidence pointers, confidence information and recency metadata. Its evidence references lead to the originating span, log entry, incident or audit event, keeping each relationship tied to the observation that supports it.
The scheduled engine refreshes context as source information changes. Automatic construction does not guarantee complete coverage or instantaneous updates, so a scheduled refresh should never be treated as proof that every recent change is already represented.
Reuse collection, but keep responsibility for source quality
If you already operate an OpenTelemetry Collector, you can add 24Observe as another exporter and fan out telemetry to both destinations without instrumenting those services again. The collector documentation explains the configuration approach. Existing collection can be reused, though any gaps in instrumentation remain.
Teams still need consistent service identifiers and adequate instrumentation across relevant call paths. Inventory must be maintained, and ownership assignments must stay current. An uninstrumented interaction cannot supply a span-derived dependency. Stale ownership data can point responders toward the wrong person. Automation removes manual edge drawing from the work, while identifier cleanup and inventory maintenance remain the team’s responsibility.
Why should every graph relationship link to supporting evidence?
Evaluate an operational context graph by its provenance first. Before relying on a relationship, check what established it and whether the underlying record is available for inspection. An unexplained edge can lead an investigator to the wrong service, owner or change. Linking the source gives another analyst a way to verify the claim independently of the graph’s interpretation.
For each relationship, an investigator should be able to inspect:
- Source record: The observation or inventory entry that supports the relationship.
- Observation time: When the activity happened, recorded separately from its collection time.
- Direction: Which entity made the call, held ownership or changed the other entity.
- Confidence information: How strongly the evidence supports the relationship, including the basis for that assessment where available.
- Freshness: When the relationship was last observed or verified, considered against the incident window.
What evidence-linked relationships mean in 24Observe
24Observe is built by our group, so weigh our view accordingly. Its documented relationships carry metadata covering confidence, recency and evidence. Each relationship’s evidence points to a specific supporting trace, log, incident or audit entry through links to records within the product.
During graph traversal, keep ordering separate from proof. The results for an entity’s neighborhood rank adjacent relationships by strength and recency. Use that ranking to decide what to inspect first; causation still needs evidence. The response containing incident context also links affected services, their ownership information and preceding changes to supporting records.
An inspectable relationship card
This editorial example shows what to review. The card uses hypothetical labels and values; it does not reproduce a screenshot or an exact API response.
| Review field | Illustrative content |
|---|---|
| Relationship | checkout calls payments |
| Direction | Caller: checkout; callee: payments |
| Supporting record | Span example-span-A, accessible through an evidence link |
| Observation time | During the incident window, at 14:03 UTC |
| Confidence information | An explicit observation of caller and callee supports the edge |
| Freshness | Supporting observation last seen at 14:03 UTC; reviewed at 14:08 UTC |
| Scope of claim | Communication occurred; responsibility for the failure is still unproven |
The confidence statement applies to whether the call relationship exists. It gives no probability that payments caused the incident. A recent observation confirms recent contact, while a persistent dependency needs further evidence. A gap in recent observations can also result from missing telemetry, so it does not establish that the relationship was removed.
Review what each record actually establishes
In this editorial evidence-review example, each record supports a different claim. Treating the records as interchangeable would overstate what they show.
| Evidence | What it establishes | What it does not establish |
|---|---|---|
| Observed call | One service contacted another at the recorded time | The destination caused the caller’s errors |
| Inventory ownership entry | The inventory assigns a person or team responsibility | That owner made the change that triggered the incident |
| Audit-recorded change | The recorded actor carried out the specified action | The action caused the outage |
In 24Observe, span observations of callers and callees supply service relationships to the context graph. Its audit records separately identify who acted, when and from what origin, including whether a person or token initiated the action. These evidence types address different investigative questions.
Several records can strengthen a hypothesis when they corroborate one another. For example, a change precedes the errors and an observed call connects the affected components; logs then show a plausible failure mechanism. Duplicate records of the same event provide less independent support. Test the association against alternative explanations and contradictory observations. When reviewing an analyst verdict with evidence citations, inspect the cited records for support for the proposed mechanism. Events occurring close together in time are insufficient on their own.
How do you investigate incident blast radius step by step?
Start with the failing condition and follow relationships supported by evidence. Keep confirmed impact separate from possible exposure throughout the investigation.
We use 24Observe, built by our group, so weigh our view accordingly. Its operational context graph connects reliability and security evidence around shared entities.
The scenario below is hypothetical and instructional. It describes neither a customer account nor a measured result. An API becomes unavailable while a suspicious administrative session implicates the same host, app-17. A reporting worker also runs there. Your task is to establish what failed, what else might be affected, and whether the administrative activity contributed.
Follow an ordered investigation procedure
-
Inspect the trigger and establish the window. Read the failed check’s condition, target and opening timestamp. Determine whether “unavailable” means failed connections, unexpected responses or timeouts. Begin with 09:50 to 10:10 UTC to include activity before the outage. Start from the incident record, remembering that the alert timestamp may differ from the time of the first failure.
-
Resolve the initial entity. Look up the API’s name before following relationships. The context lookup API translates a name into an entity identifier. Verify that the returned service belongs to the intended environment. Resolve
app-17separately: the same hostname in two records does not always identify the same machine. -
Examine immediate neighbors and the evidence behind each relationship. Request the API’s one-hop neighborhood, where 24Observe orders relationships by strength and recency. Open the records supporting its connection to
app-17. From there, explore the host’s neighborhood for identities, incidents and other workloads. This process, called neighborhood walking, means inspecting an entity, validating a useful connection and continuing from that neighbor. You do not need a full-graph visualization. -
Separate observed failures from exposed dependencies. Here, failed API requests establish observed impact. The reporting worker shares
app-17, which establishes exposure; its own status remains unconfirmed. Record it as “potentially affected” until its telemetry shows failure. Treat callers the same way. A dependency relationship gives you somewhere to investigate, while failures across connected services still require evidence. -
Identify the responsible owners. Retrieve the incident summary for affected services, ownership information and preceding changes, along with evidence references. Confirm who owns the API, host and administrative identity. The service responder handles reliability diagnosis; the security responder validates the session. Record missing or stale ownership as an explicit gap in the handoff.
-
Compare the security and reliability incidents. Check whether the administrative-session detection resolves to
app-17and overlaps the outage window. 24Observe links detection incidents to the entities they implicate. Its case workflow lets related incidents share an investigation record, owner and notes. Shared context warrants a coordinated investigation. Whether an attack caused the outage remains unproven, and automatic shared-root grouping still requires evidence review. -
Review changes that preceded the failure. Examine the changes returned in the summary. In this example, a worker configuration update precedes both alerts. Compare the update’s timestamp and scope with the suspicious session. Where records are available, use administrative audit details to distinguish human actions from automation. Determine whether the session changed anything capable of affecting the API.
-
Test an upstream-cause hypothesis against telemetry. Propose: “Higher worker concurrency exhausted memory on the shared host, disrupting the API.” Search logs for allocation failures or process termination. Compare host memory metrics with the preceding baseline, then inspect span records for request failures associated with the affected workload. Seek contradictory evidence too, including healthy requests elsewhere. 24Observe ingests spans as evidence for its context graph; the AI analyst tests proposed explanations against telemetry.
-
Document uncertainty before handing over. Distinguish supported findings from open questions. Was the session authorized? Did it change configuration? Was the worker actually impaired? Note missing telemetry and discrepancies between timestamps. Review any analyst verdict alongside its citations, and retain unresolved questions in the case notes.
Keep a compact evidence timeline
Every entry below is invented for this exercise.
| Time, UTC | Illustrative evidence | What it supports |
|---|---|---|
| 09:56 | Worker concurrency configuration changes | Candidate preceding change |
| 09:58 | Administrative session triggers suspicion | Identity investigation needed |
| 10:00 | Host memory pressure rises | Shared-host resource hypothesis |
| 10:02 | API check fails; request errors appear | Observed API impact |
The order of events proves neither causation nor malicious intent. You still need evidence linking a specific action to the resource pressure and subsequent failures.
Investigation handoff checklist
- Include incident and case references, entity identifiers and the investigation window.
- List confirmed failures separately from potentially exposed workloads.
- Attach supporting relationship records and the evidence timeline.
- Name service, infrastructure and security responders.
- Record the hypothesis, supporting evidence and contradictions.
- State whether administrative activity remains unexplained.
- Specify the next evidence request, its owner and the decision it should inform.
How do AI investigators use a knowledge graph for operations?
24Observe is built by our group, so weigh our view accordingly. Its built-in investigator, the AI analyst, shows how this works without engineers having to develop an agent. It retrieves the blast radius of an incident, searches logs, checks metrics and recent changes, and returns a verdict with citations to supporting records. The investigation guide covers the outputs: incident classification, proposed cause, affected entities, evidence and a suggested fix.
Follow a bounded investigation loop
An operational knowledge graph should guide an investigator toward records that support or challenge a possible explanation. Keep that investigation bounded:
- Resolve the entity behind the question, whether it is a service, host, identity or incident. Clear up ambiguous names before assuming similarly named components belong to the same system.
- Retrieve context around that entity and the incident being investigated. Limit retrieval to what the question needs; collecting every connected node can pull the investigation away from it.
- Follow relationships that could explain the symptom, including dependencies, ownership and changes. The context documentation explains how immediate neighbours are ordered by the strength and freshness of their relationships.
- Search the source records. Let the graph guide log searches, then inspect the evidence underneath. A dependency points to somewhere worth checking; establishing why a failure occurred requires supporting records.
- Test the proposed explanation against telemetry and timing. If an upstream failure is suspected, check whether it happened before the downstream errors. Look for evidence that would contradict the hypothesis.
- Return findings with citations. Attach the supporting records, separate direct observations from inferences, and state what is still uncertain.
The graph guides evidence gathering and reasoning. Treat a connected component as a candidate to investigate, and require source evidence before identifying it as the cause.
Give external agents the same context with restricted access
External agents can use the topology available to the built-in analyst to resolve entities, examine nearby relationships and retrieve an incident’s impact. The agent cookbook explains how to access that context.
24Observe offers REST access alongside access through Model Context Protocol. It documents four MCP context tools:
| Tool field name | Investigation purpose |
|---|---|
context_lookup_entity | Find the identifier associated with an entity name. |
context_get_entity | Fetch an entity using its identifier. |
context_entity_neighborhood | Examine the relationships directly around an entity. |
context_incident_summary | Get an incident’s impact, ownership and preceding changes, with links to supporting records. |
For assistant access, consult the MCP documentation. When developing an integration, use the agent API guide. All context endpoints require context:read. The token determines the organization identity; clients do not supply an organization identifier. Both interfaces limit context reads to the organization identified by that token. Log searches need a separate read permission, which context access does not provide.
Keep investigation separate from remediation
Using a model requires consent at the organization level. An organization can also supply its own LLM key. 24Observe strips secrets and sensitive information from investigation evidence before sending it to the model.
Context tools are read-only: they cannot change monitored systems or authorize remediation. Selected actions are available through other platform interfaces, subject to permissions and separate from graph retrieval. Give an investigative assistant read-only credentials initially. Add permissions only when a workflow has been explicitly approved, and consult the API permission reference to check the authority a connection actually provides.
Use the analyst’s verdict as a starting point backed by evidence. Before accepting a fix, engineers should follow the citations, check the timing and affected entities, and validate the suggested cause. If the source records do not support the explanation, keep it as a hypothesis.
How does a context graph compare with a dependency map or CMDB?
Start with the work each supports. A service dependency map shows connected components: which service calls another, or which application depends on a database. A CMDB manages configuration items and their relationships. An operational context graph organizes connections around investigation.
| Comparison point | Service dependency map | CMDB | Operational context graph |
|---|---|---|---|
| Primary purpose | Explain component connectivity and dependencies | Manage configuration knowledge, relationships and lifecycle context | Help investigators follow incident connections and assess impact |
| Typical entities | Services, applications, databases and infrastructure | Technical assets, owners, locations, documents and other non-technical items | Services, hosts, identities, incidents, owners and changes |
| Relationship sources | Observed traffic, discovery or declared dependencies | Discovery, integrations, federation, event-triggered updates and manual entry | Telemetry, inventory, incident records and audit activity |
| Incident linkage | Shows potentially affected upstream or downstream components | Associates incidents with configuration items and relevant changes | Makes incidents starting points for traversal through related entities |
| Evidence expectations | Ask how each dependency was identified and when | Ask for record provenance, reconciliation rules and configuration history | Expect inspectable relationship evidence, timestamps and provenance |
These categories overlap. A CMDB can contain service maps, preserve configuration history, identify ownership and represent business dependencies alongside technical assets. Its records can be maintained manually or updated automatically. Discovery and integrations can populate records; federation can combine data held elsewhere; system events can trigger relationship updates. A CMDB can also support incident analysis, investigation of preceding changes and change-risk review.
The distinction is workflow emphasis, with capabilities shared across categories. Inventory can supply asset identity, ownership and criticality to operational context. A useful configuration repository can stay in place while your team investigates telemetry through a graph. A connectivity diagram alone, however, does not establish why an incident occurred.
For a concrete implementation, consider 24Observe, built by the Networkers Home group, so weigh our view accordingly. Its operational graph is read-only and draws on existing telemetry and inventory. It uses trace-derived service connections to populate topology, with traces feeding the graph as an input signal. Investigators can follow relationships back to the supporting source record, including a log entry, span, incident or audit event. Its REST and MCP interfaces support entity resolution, evidence-ranked neighborhood traversal and incident impact retrieval. This gives investigators a way to follow evidence while retaining the role of inventory management.
Choose around the work your team actually performs. The following questions help establish whether you need a dependency view, richer configuration management, an investigation graph, or a combination:
- Configuration and change review: Do you need historical attributes, business ownership and non-technical dependencies? Test your CMDB against those requirements before proposing replacement.
- Connectivity troubleshooting: Is identifying the connected components enough, or must responders move into supporting logs to test a hypothesis?
- Incident investigation: Can responders move from the incident to affected entities, owners and preceding changes within their investigation workflow?
- Agent-assisted analysis: Can an agent resolve an entity, traverse its neighbors and return inspectable evidence through read-only investigation tools?
Which context graph approach fits your investigation workflow?
Start with the questions your team needs to answer and where the evidence sits. 24Observe is built by our group, so weigh our view accordingly. We list it first as this article’s disclosed worked example of the operational and security investigation workflow. The order carries no independent ranking or claim of superiority over the other approaches.
| Approach | Best-fit task | Architectural or deployment model | Suitable team | Evaluation boundary |
|---|---|---|---|---|
| 24Observe | Linking operational failures and security incidents with affected entities, their owners and supporting records. | A read-only graph built from inventory and telemetry, with evidence-bearing access via REST and MCP. Self-hosting is also available: see 24Observe self-hosting information. | SOC, NOC and SRE teams handling incident investigations. | Use your own incidents to check entity matching and evidence coverage, then assess whether the blast-radius view helps the investigation. |
| PuppyGraph | Querying relationships across existing sources without using ETL to create a separate graph copy. | A federated query layer with Cypher and Gremlin access. Supported sources include PostgreSQL, Snowflake and Apache Iceberg. The supplied launch example runs through Docker. | Data platform engineers and SOC teams with evidence spread across supported sources. | Treat the Docker example as launch guidance. A full production deployment specification still requires separate assessment of source access and operational needs. |
| Neo4j | Creating a connected-data graph model and querying relationships within it. | AuraDB offers managed database hosting. Teams adopting Neo4j Graph Database operate it themselves. | Engineering teams developing investigation applications backed by a graph. | Review schema design and data ingestion, along with investigation logic, independently of the hosting decision. |
| Glean | Searching enterprise knowledge and examining work relationships such as ownership, approvals and collaboration. | The architecture combines activity connectors with retrieval indexes, relationship graphs and agent memory. The supplied evidence does not specify hosting arrangements. | Teams responsible for enterprise search, knowledge and internal automation. | Check connector signals and work-context coverage against your needs. Coverage of work relationships does not establish coverage of every telemetry investigation question. |
| Beacon | Examining implementation decisions using agent execution history, configuration conditions and outcomes. | Agent trajectories shape an evolving graph without a predefined relationship model. The supplied evidence does not specify hosting arrangements. | Teams working in implementation, support and enterprise automation. | Verify that execution records preserve the decisions and downstream effects relevant to your investigation. |
| Jira Service Management | Connecting configuration dependencies with requests, incidents and change workflows. | Assets provides visibility into dependencies; CMDB records link to service workflows. The supplied evidence does not specify hosting arrangements. | IT service management teams and those responsible for configuration management. | Check how current the configuration records are and whether workflow links reveal affected services and assets. |
Evaluate the investigation workflow
Take a representative incident and ask for an answer you can verify. Which entities were involved, and who owns them? What records substantiate each relationship? With 24Observe, review the AI Analyst workflow together with the agent investigation interfaces. The SOC workflow and NOC workflow offer different operational starting points. Test whichever matches your team’s work.
Review deployment constraints separately. The supplied 24Observe security guidance points organizations requiring India-only or EU-only processing toward self-hosting. For each option, establish who will operate it and which sources it can reach. Then check what evidence an analyst can inspect when questioning a relationship or a proposed cause.
What limits context graphs for root cause analysis?
Identity resolution, gaps in legacy visibility and causal interpretation remain challenges for context graphs. Use connected entities as investigation leads and validate causation separately.
24Observe is built by our group, so weigh our view accordingly. It exposes recency alongside relationship evidence and confidence metadata. Investigators can explore connections through its operational graph, then validate those relationships against the evidence.
Use this checklist to assess failure modes:
- Missing telemetry can leave log results empty when collection fails. Distinguish an absence observed during a verified collection window from missing instrumentation.
- Unstable identifiers can cause renamed services or replaced hosts to appear as separate entities, or merge unrelated entities. Validate canonical identifiers using source records.
- Shared addresses introduced by NAT or proxies can suggest connections between unrelated workloads. Check IP relationships against evidence about hosts, identities and timing.
- Stale inventory can retain retired assets when discovery is infrequent or records are maintained manually. Check inventory freshness against collected telemetry.
- Incorrect ownership can point investigators to a team that previously held responsibility. Verify the responsible team using the current on-call arrangement.
- Incomplete visibility leaves gaps around legacy systems and dependencies that are not observed. Record the network segments and application paths without coverage.
- Privacy boundaries can prevent investigators from seeing relevant evidence. Work within data-access boundaries and document anything investigators could not inspect.
- Dense neighborhoods create noise around highly connected entities. Limit the incident window, then prioritize relationships supported by recent, direct evidence.
Check timing before interpreting topology. A dependency shown today may differ from the one present when an earlier incident occurred. Review timestamps on source events and the windows in which entities were observed. Today’s graph should not be assumed to reconstruct historical relationships.
To establish causation, corroborate the relationship with incident evidence that supports the chronology and a plausible failure mechanism. The reasoning behind a human decision may never have been captured. A large blast radius can also show potential exposure without establishing measured customer impact.
For an acceptance test, select a known incident and trace one relationship back to its source record. Verify who owns it, then state explicitly what the graph cannot establish about the cause, timing or customer impact.
Context graph FAQ
What is a context graph in incident investigation?
A context graph represents operational entities and the relationships that help explain an incident. Investigators can follow an alert’s connections to affected infrastructure, identities, ownership and supporting records. 24Observe is built by our group, so weigh our view accordingly. Its context graph builds a read-only model of the operational environment from telemetry and inventory, with evidence supporting the connections used during investigation.
Is a context graph the same as a knowledge graph?
The terms overlap, though their behavior can differ. A knowledge graph describes entities and relationships; “context graph” usually emphasizes connections relevant to a particular task. For incident response, check whether the operational entity model links infrastructure and identities to incidents and their supporting evidence. AI and data platforms use the label for different structures. Evaluate the relationships you can explore and the queries you can run rather than relying on the name.
Does automatic discovery require new agents or instrumentation?
Automatic discovery depends on usable source data. Relationships that leave no observable evidence remain outside its reach. 24Observe builds its graph at scheduled intervals from operational records and telemetry. An existing OpenTelemetry collector can forward signals without instrumenting services again; see the collector configuration and parallel telemetry export guidance. Caller/callee information in traces supplies service dependencies. 24Observe ingests those traces as a signal that feeds its context graph, using them to derive relationships between services.
What does blast radius mean in a context graph?
Blast radius describes which entities an incident could affect through operational relationships. Investigators use it to identify relevant services and hosts, along with identities and owners. A connection alone does not confirm that an entity is affected. The 24Observe incident summary includes supporting records for impact context, ownership and changes preceding the incident. Review those records to distinguish a possible downstream consequence from an observed failure.
Can a context graph prove root cause?
No. A relationship establishes a connection, while matching timestamps establish sequence. Neither proves causation on its own. Investigators still need to test explanations against failure symptoms and changes, including evidence that contradicts the explanation. The 24Observe AI analyst checks its proposed explanation against telemetry. Graph relationships include metadata for confidence and freshness, plus supporting evidence. The resulting verdict is an evidence-backed assessment that needs verification, particularly where telemetry coverage is incomplete.
Can AI agents query the context graph safely?
24Observe provides REST and MCP access for reading the graph. Access requires context:read and is limited to the organization associated with the token. Through its MCP access model, an assistant can investigate without receiving permission to alter operational state. The context API permissions cover looking up entities, exploring their neighborhoods and retrieving incident impact context. These controls bound the investigation. Before acting on an agent’s recommendation, teams should review its token permissions and the evidence it returned.
Does a context graph replace a CMDB?
A context graph can coexist with a CMDB without replacing it. A CMDB holds configuration items with their attributes and relationships, and can link incidents to assets for root-cause work. An operational context graph can supplement that repository with relationships derived from telemetry and evidence for investigations. Establish which system owns each attribute, how identities will be reconciled and how often records should refresh. CMDB data can be entered manually, discovered or mirrored from other tools. Keeping both systems does not inherently require relocating the CMDB’s primary records.
Frequently asked questions
What is a context graph in operations?
In operations, a context graph connects entities such as applications, machines, identities and incidents through meaningful relationships. Those connections help an investigator move from an alert to relevant dependencies, ownership and supporting records. A useful graph also preserves when a relationship was observed and where its evidence came from. The purpose is to support investigation, rather than simply draw an infrastructure diagram.
How is a context graph different from a knowledge graph or entity graph?
A knowledge graph is a broad way to represent entities and their relationships. An operational context graph applies that representation to investigation questions, including affected dependencies and responsible owners. An entity graph emphasizes associations among identifiable objects. In 24Observe, the entity graph connects host activity, user identities and IP addresses across incidents, while the operational context model covers additional entities and relationships.
Does building a context graph require manually mapping every service?
Not necessarily. 24Observe derives operational context from telemetry and inventory, with scheduled processing of several existing data sources. It can infer service dependencies from the caller and callee information in spans. That avoids drawing every dependency by hand, but it does not eliminate data preparation. Missing instrumentation, inconsistent identifiers or outdated ownership information can still leave gaps or make relationships difficult to interpret.
What does incident blast radius mean in a context graph?
Blast radius describes the connected entities that an incident affects or could affect, depending on the evidence available. Investigators should distinguish confirmed failures from dependencies that merely appear exposed. In 24Observe, context summaries surface affected services, ownership information and preceding changes with supporting references. Traversing nearby entities helps establish scope, but graph proximity alone does not prove that every connected component has failed.
Can a context graph prove the root cause of an incident?
A graph can expose relationships that support a root-cause hypothesis, but a connection alone is insufficient proof. Investigators still need a plausible timeline, relevant source records and checks against competing explanations. 24Observe's analyst uses graph context alongside telemetry and checks its explanation against observed signals. Engineers should review the cited evidence and distinguish an observed dependency from a demonstrated causal chain.
Can an AI agent investigate through a context graph without changing systems?
Yes, when the investigation interface provides read-only access. 24Observe exposes context operations through REST and MCP, including entity lookup, entity retrieval, neighborhood exploration and incident context summaries. These operations require context:read and remain scoped to the organization associated with the token. Reading operational relationships is separate from authorizing remediation, so an investigation agent does not need permission to modify the systems it examines.
Does an operational context graph replace a CMDB?
It does not inherently replace one. A CMDB records configuration items and their relationships, and can connect those items to incidents, changes and problem investigations. It may receive information through discovery or integrations rather than manual entry alone. An operational context graph can use inventory alongside telemetry to answer investigation questions. Decide whether they complement each other by examining data ownership, evidence quality and the workflows your team needs.