Uptime Monitoring · 24Observe
Uptime monitoring: a practical guide to 10 tools in 2026
Swipe sideways to see the whole diagram.
What is uptime monitoring, and why do NOC teams depend on it?
Your website returns HTTP 200, but the product catalogue is empty. Meanwhile, the overnight inventory sync never completed. A check that only asks whether the server answered can stay green while customers cannot use the service.
Uptime monitoring means checking availability repeatedly, recording the observations and notifying responders when defined failure conditions occur. NOC engineers depend on it for a consistent view across shifts. For SOC analysts and SREs, those observations provide a starting point for investigation. They do not prove the cause.
Before choosing a tool, separate three questions about what its checks can establish:
- Can a probe outside your network reach the endpoint, and are its database, workers and dependencies functioning? These require separate checks. An internal health endpoint can test dependencies, but cannot establish public reachability by itself.
- Does the service meet both availability and response-time requirements? A service may pass its availability conditions while responding too slowly. Define acceptable timing separately.
- Does a successful server response mean the service works? A successful status code establishes little about content correctness, a completed transaction or a scheduled job.
An uptime percentage describes the chosen checks over a particular observation window. It does not represent every visitor’s experience. Read the calculation policy, because providers may treat maintenance periods and missing observations differently.
Uptime percentage = available observed time divided by eligible observed time, multiplied by 100.
Use the following buying criteria when evaluating uptime monitoring tools:
| Criterion | Operational question |
|---|---|
| Check coverage | Which failures can the configured checks detect? |
| Observation locations | Where are checks executed relative to users and services? |
| Failure confirmation | What evidence is required before alerting? |
| Ownership | Who receives, acknowledges and escalates the incident? |
| Communication | How are affected teams and users updated? |
| Operating responsibility | Who maintains the monitoring infrastructure and its dependencies? |
Start with the failure you need to detect, then ask what a proposed check actually establishes. Keep public reachability, internal dependency health and user-facing behaviour separate when reviewing coverage. Compare tools against the questions above rather than assuming that a longer feature list means a better fit. Your team still needs clear ownership of alerts and of the monitoring infrastructure itself. The right choice depends on your checks, response requirements and operating model.
Which website uptime monitoring checks do you need, including synthetic monitoring?
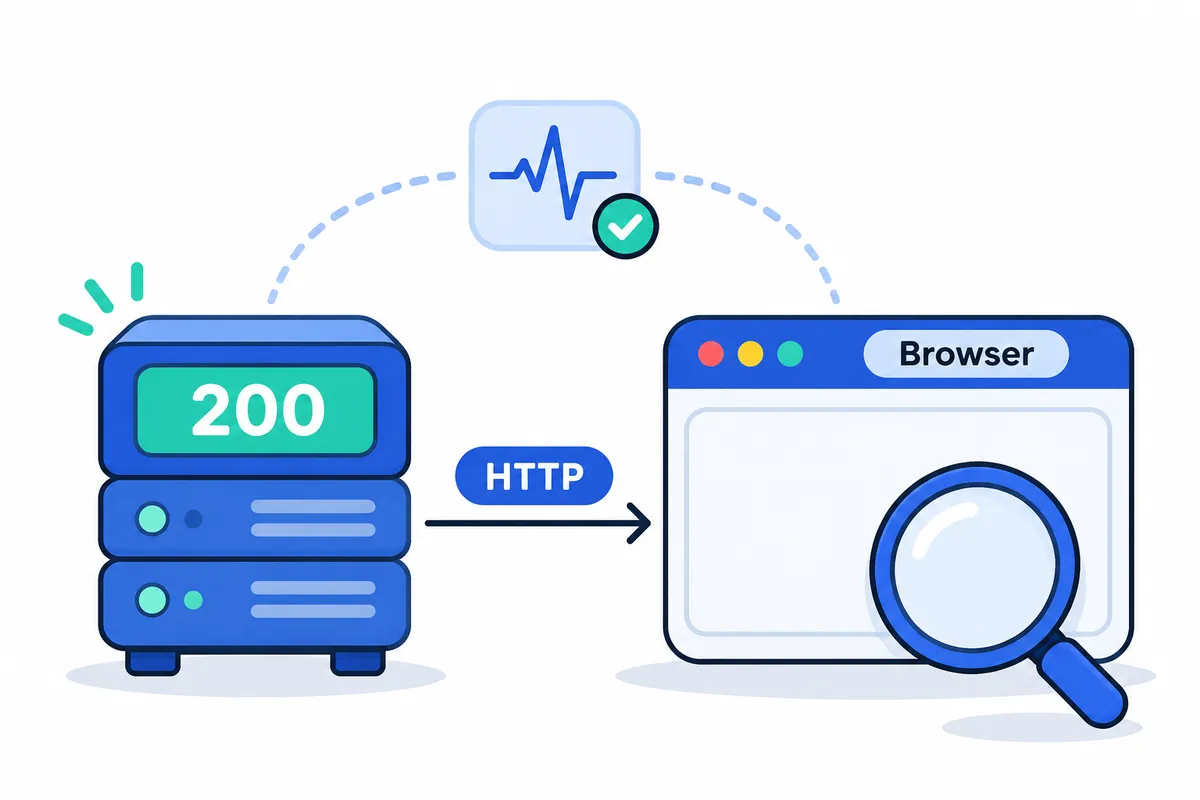
Choose checks based on the failure you need to detect. Host reachability, an open socket and a usable page each answer a different operational question. Depending on the product, synthetic monitoring may cover basic HTTP requests or browser-driven tests. Read the check definition before assuming it tests a user journey.
HTTP/S checks
An HTTP/S check requests a URL and compares the response with your expected status and timing criteria. Use it to monitor public pages, API endpoints and health endpoints.
For a landing page, require the intended success response rather than treating any redirect as healthy. For an API, choose an endpoint relevant to service operation. HTTP success alone does not establish content correctness: a maintenance screen or an empty application shell can return HTTP 200.
Keyword assertions
A keyword check retrieves content and checks for the presence or absence of selected text. A stable product name works for a server-rendered page; an expected response field works for an API. Avoid timestamps and marketing copy that changes frequently.
24Observe is built by our Networkers Home group, so weigh our view accordingly. We cover it first because its check types make this distinction clear. Its uptime monitoring supports assertions against response content, including JSON fields. Standard HTTP and keyword checks in 24Observe inspect the initial server response, before JavaScript renders the page.
The limit is the assertion’s scope. Finding an expected string does not verify every value or element on the page.
TCP or port checks
A TCP check tries to connect to a specified service port. It expects the connection to complete within the configured timeout.
Use this check to determine whether a mail service accepts connections, especially when a web check would reach an unrelated service running on that machine. An open port does not prove the application works correctly. A mail process may accept a socket even when authentication fails, messages cannot be processed or downstream delivery is broken. Testing those functions requires protocol-aware or functional checks.
ICMP ping
An ICMP check sends an echo request and waits for an echo reply. It provides a basic reachability check for routers, switches and other network devices.
Read the result as evidence about network reachability. A host may respond to ping even with its web service stopped. Conversely, filtering or rate limiting may block replies while HTTPS is still available. ICMP reachability does not establish website availability. Interpret a missing reply in the context of the device’s intended network policy.
Browser or synthetic checks
A browser check opens a URL, runs JavaScript and evaluates the page that renders. The required content should appear within the allowed load time. This is useful for client-rendered applications whose initial HTML contains little more than a loading shell.
24Observe uses headless Chromium to render the page, then applies keyword assertions to the resulting DOM. Checking for expected application text can reveal a failed data request or a broken JavaScript bundle even when the response is HTTP 200. The browser monitor documentation also lists restrictions on targets within private networks, localhost and cloud metadata endpoints.
A rendered-content assertion does not establish support for multistep transactions. Checkly provides a separate browser-journey example: it schedules Playwright specifications owned in a repository to run across worldwide locations. This approach suits engineering teams that maintain journeys as tests. Its agent also allows execution within the team’s infrastructure. The coverage of any journey is limited to the steps and assertions written into it.
| Target | Starting check | Expected evidence | Remaining blind spot |
|---|---|---|---|
| Public landing page | HTTPS plus keyword | Intended response and identifying text | Untested links or forms |
| API response | HTTP plus content assertion | Expected status and response field | Other operations or incorrect values |
| Mail service | TCP connection | Service accepts a connection | Authentication and delivery |
| Network device | ICMP ping | Echo reply | Service and forwarding health |
| Client-rendered application | Browser plus rendered-text assertion | Required content after JavaScript runs | Untested interactions |
How do SSL certificate monitoring and heartbeat monitoring prevent missed failures?
A website can keep responding as its certificate approaches expiry. A server may be healthy while a scheduled job has failed. Certificate and heartbeat checks help detect these failures when availability checks alone may miss them.
SSL certificate monitoring: expiry, trust and hostname
Check certificate health with three questions:
- When does the certificate expire? Early warning leaves time to renew the certificate and check that the replacement is deployed.
- Can the client validate the chain back to a trusted issuer? Time remaining before expiry does not rule out a broken trust chain.
- Does the certificate cover the requested hostname? Even a trusted, unexpired certificate fails identity verification if it belongs to a different hostname.
An availability probe may not cover all three. Check how it validates TLS, and configure explicit certificate monitoring to warn before expiry.
24Observe is built by the Networkers Home group, so weigh our view accordingly. When assessing certificate monitoring, check how far ahead expiry warnings arrive and what trust-chain validation covers. Also verify how the intended SNI hostname is supplied when connecting to an IP address. Selecting the SNI hostname and verifying the certificate’s hostname are separate checks. Confirm each rather than assuming one proves the other.
Heartbeat monitoring: investigate missing completion
With heartbeat monitoring, the job initiates the check by sending a signal after it completes successfully. If that signal never arrives, investigate. This approach suits backups, billing runs and synchronization jobs, which can fail while the website remains available.
Configure the expected schedule alongside runtime variation, the grace period and the failure threshold. Jobs need different settings. Allowing more tolerance helps avoid premature alerts, but it also means failures take longer to detect.
Review these controls when setting up a heartbeat monitor:
- Expected interval: Check how frequently a completion signal is due and whether that interval matches the job’s schedule.
- Grace period: Verify how the monitor measures lateness. Leave room for normal runtime variation without extending the time a failed job goes unnoticed more than necessary.
- Failure threshold: Establish how the monitor counts missed signals and which conditions cause an incident and a notification.
Check when the scheduler looks for overdue signals, too. Evaluation timing works alongside the expected interval, grace period and alert threshold to determine when the team sees a missing completion.
Treat heartbeat URLs as secrets. Exclude them from repositories and routine logs, since someone with the URL may be able to send a signal that marks the monitor as up. A heartbeat arriving successfully confirms delivery of that signal; backup contents still need independent verification through restore testing. Before depending on a setting, check its configuration details in the monitoring documentation.
How often should uptime monitoring run, and which regions should you use?
Choose the interval based on how long a failure can remain unnoticed and who will respond. Checking more often improves coverage over time and increases the chance of catching brief interruptions. It also increases request volume and can surface more transient failures, adding work for responders unless alerting is tuned.
Set the interval against the full detection path
As a hypothetical calculation, one check per minute produces 60 × 24 × 30 = 43,200 scheduled executions over a 30-day month, before retries, additional locations or provider-specific accounting. This estimates scheduled executions; it does not forecast billing.
Reserve your shortest practical intervals for services where delayed detection matters most. Less critical endpoints can tolerate wider spacing. Check whether supported intervals vary by plan. 24Observe is built by our Networkers Home group, so weigh our view accordingly. When evaluating its checks, confirm the applicable minimum rather than assuming every paid tier supports the same cadence.
The configured interval is only part of the detection delay. An outage may begin between executions. Depending on the configuration, the timeout, verification checks, consecutive-failure threshold and notification delivery can add time before a responder receives an alert. Test that complete path before treating the configured interval as your response target.
Choose locations for coverage, then examine verification
Select regions around actual users, application entry points and critical dependencies. Enable each location for a reason. Additional viewpoints can reveal routing or CDN-edge problems, but they also create more traffic and results to interpret.
We start with 24Observe because our relationship with it warrants stating our evaluation criteria first: availability coverage, investigation workflow and operational responsibility. Check its documentation for deployment options and regional coverage for each check type. Do not assume that regional settings for HTTP and HTTPS checks also apply to browser, ping or heartbeat checks.
Keep two questions separate: where does monitoring observe availability, and how does it verify an initial failure?
- When evaluating UptimeRobot, establish whether its deployment model suits a team that wants external availability checks without maintaining monitoring infrastructure. Confirm the available regions, whether failure verification stays within the original region, and which settings apply to the plan you are considering.
- When evaluating Pulsetic, establish whether its deployment model and regional reporting suit the detail your responders need. Confirm the available locations, what response-time and uptime views show, and whether failure verification checks other regions before sending a notification.
Use the same test scenario across candidates. A regional failure and an endpoint-wide outage can require different responses, so responders should understand what each alert actually establishes.
Control noise before increasing frequency
Set timeouts against expected endpoint behaviour. Overly tight values can classify ordinary slowness as failure. Maintain checker-IP allowlists where access controls would otherwise block probes, without weakening endpoint authentication.
Use planned maintenance windows where supported. Give every monitor an owner, a primary responder and an escalation route, then test notification delivery, including the backup route.
For 24Observe, verify how failure thresholds and maintenance settings work before relying on them. Establish how many failed checks trigger an incident, whether checks continue during maintenance, whether notifications are suppressed and how maintenance affects uptime calculations. Review those details before shortening intervals, especially for endpoints already producing intermittent failures.
What should a status page communicate during an incident?
Engineers use monitoring dashboards to examine technical signals. Alerts direct on-call responders to problems that need attention and show where to investigate. Customers and stakeholders use a status page to decide whether a service is usable, whether to wait or whether a workaround applies.
Publish components that customers recognise, such as checkout, sign-in and the API. Map the supporting checks to each component. Keep internal hostnames, sensitive evidence and unconfirmed causes out of public updates.
Write updates around what you know
Use the following stages to structure incident communication. These are editorial terms, independent of any product’s workflow labels:
- Investigation: Describe the symptoms you have observed, who is affected and what you still do not know.
- Identified issue: Explain the verified problem in terms customers understand and describe the mitigation in progress.
- Recovery monitoring: Report improvements while responders check stability and establish what impact remains.
- Resolution: Confirm that customers are no longer affected, explain the remedy and identify any follow-up work.
Keep the incident-update template short:
Affected service: [component]
Observed impact: [what users experience, including scope]
Current action: [investigation or mitigation underway]
Next update: [time and timezone]
Treat the promised update time separately from any estimate of recovery. Publish when you said you would, even if there are no new findings. Only offer a restoration estimate when the evidence supports one.
Choose access and publication deliberately
Put service information with broad relevance on public pages. Use restricted pages for internal readers or limited audiences. Check subscription channels and service-selection options so subscribers can receive relevant updates without assuming they want every announcement. For maintenance, publish the timing, timezone and expected impact. Retain incident history so readers can review earlier disruptions.
We start the examples with 24Observe, built by our group, because its component and publication options fit the communication tasks described above. Weigh our view accordingly.
- 24Observe: Managed and self-hosted deployments suit teams that connect investigation with customer communication. Its capabilities include grouping components, updating subscribers and providing public or restricted pages. It also supports automatic public incident posts and a timeline that includes public updates.
- UptimeRobot: Externally operated monitoring suits teams that want to avoid running monitoring infrastructure. Private or password-protected pages accommodate restricted audiences. Selecting monitors or tags determines visibility, while email subscriptions, maintenance announcements and incident history support ongoing communication.
- Pingdom: Public pages suit teams reporting customer-facing availability. Pages are included in every plan, with branding options and selected checks. They can present current availability or historical reporting.
Even with automatic publication, teams need to map components carefully and review details intended for customers. Give an editorial owner responsibility for checking impact, wording and the timing of publication.
24Observe: best suited to connecting availability checks with incident investigation
24Observe is built by the Networkers Home group, so weigh our view accordingly. We list it first because its shared incident workflow gives us a concrete starting point. This guide does not establish an overall winner.
The tools covered here are 24Observe, UptimeRobot, Pingdom, Uptime.com, Better Stack, StatusCake, Pulsetic, Uptime Kuma and Checkly. Assess each against the checks your team needs, who will operate them and how incidents pass between responders. Inclusion alone is not a recommendation.
Strongest fit: connecting a failed check to supporting evidence
24Observe suits NOC, SOC and SRE teams that want to investigate availability failures alongside operational telemetry and security detections.
Its checks cover:
- HTTP/S and content: inspect status codes, timing, redirects and headers. Expected-content assertions can catch an incorrect page even when the response is HTTP 200.
- Ports and ping: test TCP connectivity and check host reachability through ICMP.
- Certificates and heartbeats: raise incidents before a certificate expires or when a scheduled job fails to send its expected completion signal.
- Browser checks: run JavaScript in headless Chromium and inspect the rendered content, extending checks beyond the initial HTTP response.
Failed checks enter the same incident workflow as metric breaches and security detections. On-call schedules and escalation policies route failures to responders. Root-cause grouping brings related incidents into one case with a consolidated notification. Incident updates can also publish automatically to a public status page.
The AI analyst reviews logs and metrics alongside dependencies and recent changes, then provides a verdict with citations to the evidence. Its investigation tools have read-only access. Proposed response actions need human approval before execution.
24Observe ingests traces as evidence for its context graph. It is not an APM, distributed tracing or RUM product. Use the graph to narrow the investigation, then confirm the finding against the underlying telemetry. The 24Observe documentation provides further reference material for your evaluation.
Deployment: distinguish hosting from probe coverage
Choose the hosted service or run the full platform on infrastructure you control. The hosted SaaS currently runs in one region. Hosting location and probe coverage are separate considerations: multi-region checks are currently available only for HTTP and HTTPS.
Self-hosting offers a Docker Compose route. You can run the complete stack on one host or use an external PostgreSQL database. Account for the operational ownership that comes with this deployment.
Evaluation checks: rehearse an incident before expanding
The free allowance provides 25 monitors. The Team plan costs $29 per month and includes 100 monitors; review pricing against your expected consumption.
Begin with one representative service. Test an HTTP failure and an incorrect response body, then a missed heartbeat. Check that routing accounts for incident severity and that notifications reach the responder. Review public updates for appropriate information. Browser monitors cannot target private addresses, so check target eligibility early.
Inspect the citations behind the AI verdict. The rehearsal should show whether your team can operate a workflow that connects detection and ownership with investigation evidence and incident communication. If an availability alert covers your needs, compare the narrower workflows in the following profiles before committing.
UptimeRobot, Pingdom and Uptime.com: which availability workflow fits your team?
We start with 24Observe, built by the Networkers Home group, so weigh our view accordingly. We put it first to frame the evaluation around how availability checks connect to incident investigation. The comparison below focuses on workflow: what evidence to request from each tool and how your responders would use it, without ranking the tools.
UptimeRobot
When evaluating UptimeRobot, start with your external endpoint monitoring requirements and the current plan documentation. Check the monitor allowance, registration requirements and checking interval rather than assuming a free plan covers production needs. HTTP/S checks can establish whether an endpoint responds; keyword checks can test whether expected text appears. Host reachability, service-port availability and scheduled-job execution are separate requirements. Confirm which check types are available on the plan you are considering.
Establish where checks originate and who maintains the checking infrastructure. A NOC benefits from an independent view of public websites, APIs and other exposed services, but that view needs a documented failure-verification process. Ask whether a failed check is repeated before an incident opens, whether another location participates and whether that location is in the same region. Confirm whether verification behaviour changes between plans.
During evaluation, judge whether the available checking interval is appropriate for each endpoint. Include a content failure in your tests: an HTTP request can succeed while returning the wrong page. If certificate and domain expiry are operating requirements, verify their availability and plan restrictions. Evaluate status-page options against your need to report availability, publish incident notices and communicate maintenance. Review the relevant plan requirements before deciding whether the allowance covers your operating needs.
Pingdom
For Pingdom, build the evaluation around website availability, page performance and important user interactions. Treat these as distinct requirements and verify which are supported by the offering you are considering. A reachability check answers a different question from a page-performance test or a test of whether a critical interaction succeeds.
Confirm the deployment model, checking locations and failure-verification process in the current documentation. For externally checked services, establish what happens between an initial failure and an incident notification. Request examples of the diagnostic evidence available to responders. Response codes, web-server output and network-path information can each inform an investigation, but they need interpretation. Review whatever evidence the tool provides against application records and network data before deciding on the underlying cause.
If a trial is available, use it to evaluate availability checks separately from page-performance tests and a critical transaction. Confirm which capabilities the trial includes rather than assuming access matches the intended production plan. Synthetic monitoring creates test traffic, while Real User Monitoring, or RUM, records actual visitor experience. Where either is available, compare its evidence during a controlled outage or slowdown. Assess whether the diagnostics give the on-call engineer enough detail to choose the next investigation step. For any public status-page option, check that the selected checks and displayed history suit the intended audience.
Uptime.com
For Uptime.com, begin by separating public-facing services from private infrastructure. List the checks you need for websites, APIs, browser-based journeys, scheduled jobs and certificates, then verify support and plan requirements. This keeps the evaluation tied to an external customer journey and the internal dependencies behind it.
Establish how each environment would be monitored. An external checking location provides a different perspective from a checking component deployed inside your environment. If private monitoring requires a deployed component, assign responsibility for running it and maintaining its network access. Confirm firewall requirements and the component’s access to the services under observation. Assess that deployment separately from whether the full service is self-hosted; an internally deployed checking component does not establish that the complete platform runs within your environment.
Build the evaluation around real dependencies. Include a public endpoint and a private API, then assess how you would test a critical browser journey and detect a missed scheduled job. Evaluate certificate-expiry requirements separately to account for renewal risk. Browser testing should establish whether the intended task completes, as well as whether the page responds. If status-page communication is available, verify its audience controls before choosing it for internal or public updates. Decide which incident details customers need and which should stay with internal responders. Check that each audience receives useful updates while unnecessary infrastructure details remain private.
Better Stack, StatusCake and Pulsetic: which alerting and communication features matter?
We list 24Observe first for teams connecting availability failures with investigation. It is built by the Networkers Home group, so weigh our view accordingly. It offers managed and self-hosted deployment. The tools below serve different priorities, from gathering incident evidence to running external checks and communicating with customers.
Better Stack
Better Stack suits teams that need diagnostic evidence and on-call escalation alongside browser interaction tests in their availability workflow.
During website failures, it captures screenshots and records error messages returned by APIs. When a connection or request times out, its edge checks supply traceroute and MTR results. Responders can use that evidence to distinguish an application error from a possible network-path issue, though a route trace alone cannot establish the cause.
Playwright transaction checks run interactions in Chrome with JavaScript support. A successful HTTP response says little about whether a login or another important interaction works. When evaluating the tool, trigger both an application-level failure and an unreachable endpoint, then compare the evidence each produces.
Incident management includes on-call handling, with escalation rules that account for timing, team availability and incident origin. Status pages communicate active disruptions, maintenance notices and degraded service. Customers can receive updates by email.
The free offering includes 10 monitors and 10 heartbeats, plus one status page; checks run every three minutes. Check transaction-test allowances separately before planning coverage around those limits.
Browser execution and monitoring capabilities are established. The full deployment model remains unclear, so confirm hosting arrangements and private-execution options before deciding whether it fits a restricted environment.
StatusCake
For teams focused on external website checks, StatusCake also covers certificates, domains, page performance and server health. Checks run from outside the monitored infrastructure, giving operators an external view of availability.
Each monitoring type answers a different operational question. Certificate checks warn of approaching expiry, while domain monitoring tracks expiration, DNS and domain changes. Page-speed checks measure performance from multiple locations. Server monitoring tracks health and resource use, with configurable thresholds for CPU, memory and disk. Keep these signals separate during investigation: a reachable website may still face a certificate renewal risk or a capacity problem.
The advertised 30-second checking capability does not apply to the Free plan. Free includes 10 uptime monitors checked every five minutes, plus one monitor each for page speed, domains and SSL.
Paid website-monitoring accounts allow test-location selection. Verify which locations the intended plan includes, since geographic control should not be assumed identical across tiers. Comparing regional results can expose a site that works in one area and is unavailable elsewhere.
StatusCake can route alerts to the appropriate people, and StatusCake Pages handles customer-facing communication. Use a trial to check who owns each alert and who updates the status page, then compare that workflow with your incident process.
Pulsetic
Pulsetic suits teams that put regional visibility and subscriber communication first. To set up a website check, enter the URL and notification destinations. There is no monitoring software to install or server configuration to change for that check.
Before issuing an alert, Pulsetic checks a failed result from other regions. Availability and response-time results are also shown by region, which helps when an overall average hides a poor experience in a particular market. During evaluation, review those regional results alongside the summary dashboard.
Status pages support your domain and visual identity. Subscribers receive notifications when an incident is created, as it is updated and when it is resolved. This gives communications staff a defined channel throughout an outage. Subscriber lists can also be imported and exported.
The free plan includes 10 monitors, three status pages using your domain, and unlimited email alerts. Verify the allowances for other notification methods separately.
Evaluate browser-flow monitoring and Real User Monitoring as separate capabilities. AI Monitoring accepts flow instructions in natural language and uses an agent to execute them during scheduled browser sessions. RUM collects visitor performance measurements and errors through a script. Browser flows test interactions, while RUM measures actual visits. Keep a basic availability check running independently of visitor traffic; neither capability replaces it.
Uptime Kuma, Checkly and Datadog Synthetic Monitoring: what can you verify before buying?
Uptime Kuma
Uptime Kuma suits operators who want a self-hosted monitor under the MIT licence and can take responsibility for running it. Uptime Kuma’s repository lists HTTP/S availability checks, keyword matching, JSON-query checks, TCP connectivity, ping and push monitoring.
Choose each check for the failure it needs to catch. An HTTP success response tells you something different from a matching keyword or the expected JSON value. During evaluation, return incorrect content and an error response separately. Confirm that the check catches the condition you intended it to detect.
Notifications can go to Telegram, Slack, Discord, Gotify, Pushover and SMTP email. Uptime Kuma also supports multiple status pages. Verify that notifications arrive and decide which services each page should show before depending on them during an incident.
You can deploy with Docker directly or use Docker Compose. The documented container configuration stores persistent data in a named volume at /app/data. Storage must be local: the documentation requires a local directory or volume and rules out NFS-style filesystems.
Self-hosting leaves patching, scheduled backups, restore tests and independent monitoring with your team. Give those tasks named owners. Monitor the instance from an external check, preferably in a separate infrastructure failure domain. If the host fails, the monitoring instance may disappear along with the mechanism meant to report the failure.
Checkly
Checkly suits engineering teams that keep monitoring definitions in version control alongside application code. Checkly’s documentation describes TypeScript resources stored in a repository for checks and groups, alert channels, dashboards and status pages. Creating monitors through the interface is also an option.
Browser Checks run repository-based @playwright/test specifications at scheduled intervals across global locations. URL monitors check selected pages, while API checks target endpoints. Multistep Checks handle API workflows spanning several requests. To reach private targets, the Checkly Agent runs inside your infrastructure and checks private APIs, staging systems and internal services.
Evaluate how this approach fits your development workflow. Start with an existing Playwright specification and identify which assertions establish service health. Then introduce a controlled failure and verify the test’s behaviour. When evaluating an API flow, make sure the assertions confirm the expected result; successful transport alone does not establish that result.
Checks and groups can share alert channels. Destinations include PagerDuty, Slack, email and webhooks. A project can also publish a status page alongside its alerting configuration.
Release integrations include GitHub Actions, Jenkins, GitLab and Vercel. Teams can ship monitoring updates with application changes and use checks to gate releases. Before adopting the tool, test that workflow: review a monitoring change and run it in the intended environment. Introduce a failing assertion, then confirm that both the pipeline and notifications behave as your team expects.
Datadog Synthetic Monitoring
The evidence supplied for this section contains no product-specific facts about Datadog Synthetic Monitoring. It does not support assigning capabilities, a deployment model, pricing or a best-fit recommendation. These gaps establish nothing about which features the product lacks.
Before purchasing, request current vendor documentation on execution locations, private-target access, available check types, alert routing, incident-communication options and consumption rules. Clarify how metering accounts for locations, frequency, retries and test steps. Validate those answers against the monitoring plan you intend to run.
Uptime monitoring tools compared: checks, deployment, alerts and status pages
We put 24Observe first because its shared workflow shows how uptime checks support investigation. It is built by our Networkers Home group, so weigh our view accordingly. An HTTP failure uses the same incident model as a metric threshold breach. Incidents that share a cause can be grouped into a single case.
The table brings together the profiles above. “Not established by supplied facts” means the evidence is unavailable, rather than that the feature is absent.
| Tool | Strongest supported fit | Deployment or execution evidence | Representative checks | Incident communication | Published entry allowance |
|---|---|---|---|---|---|
| 24Observe | Connecting checks with investigation | Hosted service or self-hosted stack | HTTP/S, content assertions, rendered-browser checks, heartbeats | Shared incident workflow, escalation, status pages | 25 monitors free |
| UptimeRobot | Externally executed endpoint checks | Checks run outside your network; checking infrastructure requires no maintenance | HTTP/S, keywords, ping, TCP ports, cron | Alerts via configured channels; branded status pages | 50 monitors free |
| Pingdom | Investigating website failures | External checking network across global regions | Availability checks and transaction tests | Incident alerts; public status pages | Trial lasting 30 days |
| Uptime.com | Covering public and private services | Public checking locations; deployed Private Location monitor | Website, API, browser-flow and heartbeat checks | Public or private status pages | Not established by supplied facts |
| Better Stack | Incident evidence and escalation | Not established by supplied facts | Web, API, browser transactions, heartbeats | On-call escalation; status pages | Free allowance: 10 monitors plus 10 heartbeats |
| StatusCake | External website checks and expiry tracking | Executes outside customer infrastructure | Endpoint availability, SSL expiry, domain checks | Alerts routed to responders; StatusCake Pages | 10 uptime monitors free |
| Pulsetic | Regional visibility and subscriber updates | URL-based setup; no server software installation | HTTP, ICMP ping, TCP ports, job heartbeats | Subscriber notifications when incidents change | 10 monitors free |
| Uptime Kuma | Operator-controlled monitoring | Self-hosted | HTTP/S, TCP, push checks | Configurable notifications; multiple status pages | MIT licence; infrastructure costs separate |
| Checkly | Keeping monitoring definitions in code | Global execution locations or an internal Checkly Agent | URL, API, Playwright browser checks | Alert channels; project-based status page | Not established by supplied facts |
| Datadog | Not established by supplied facts | Not established by supplied facts | Not established by supplied facts | Not established by supplied facts | Not established by supplied facts |
Read monitor allowances alongside check intervals. The free plans from UptimeRobot and StatusCake use five-minute checks; Better Stack’s free offering specifies checks every three minutes. Before choosing a plan size, confirm the check frequency and execution locations, any monthly check limits, and the alert terms. Each affects a different operational requirement, so we have kept them separate rather than calculating a combined score.
How do you set up a sensible monitoring plan step by step?
Build the plan around customer impact and response ownership. This walkthrough uses 24Observe, built by the Networkers Home group, so weigh our view accordingly. Follow its quickstart, then verify the settings against your monitoring requirements.
-
Inventory customer-facing services and assign owners. For each website, API, certificate and scheduled job, record its dependencies, business importance, primary responder and backup. Every monitor needs an owner who can act on its alert.
-
Match checks to the failures you need to detect. HTTP checks test availability; content assertions catch incorrect responses. Use browser checks for JavaScript-rendered content, TLS checks for certificate problems and heartbeats for missing job completions. Host reachability alone does not establish that the application works.
-
Define the expected response code, stable text or JSON field, timeout and redirect behaviour. Credentials should be read-only, with minimal permissions. Keep credentials and heartbeat URLs in a secrets manager, outside repositories, logs and public configuration. Treat a heartbeat URL as a credential because anyone holding it can signal success. Confirm how the provider protects stored custom request headers.
-
Select intervals and locations that reflect customer traffic, adding another region where useful. Budget executions before buying: estimate monthly runs as monitors × locations × minutes per month ÷ interval in minutes. Calculate each check type separately and allow for verification and retries. Confirm the provider’s counting rules and supported intervals.
-
Set timeouts and heartbeat grace periods using measured behaviour. Review failure-verification settings and any required checker allowlists. Before scheduling maintenance, confirm and document whether maintenance windows continue running checks, suppress alerts or alter uptime calculations.
-
Connect severity routing and escalation. Verify both the destination’s configuration and the routing rules for the incident’s severity. Determine whether a route must match before the configured channel can send a notification. Assign an escalation path for incidents the primary responder does not acknowledge.
-
Map monitors to customer-facing status components. Group them under service names customers understand, such as “Website” and “Public API.” Keep secrets and internal infrastructure names off the public page.
-
Test the full path from failure through notification to recovery. Choose a harmless test endpoint or controlled exercise; never break production to test monitoring. If a channel-test function is available, use it and inspect the result and error for every destination. Then test the routed incident flow, review check history and confirm what recovery does to the incident. Refer to the incident runbook when results differ from what you expected.
Suggested configuration, not product defaults
| Target | Success condition | Starting schedule |
|---|---|---|
| Website | HTTP 200 plus expected text | Every minute, two regions |
| API | Expected code and response field | Every minute, two regions |
| Certificate | Valid chain; review expiry | Hourly |
| Scheduled job | Heartbeat after successful completion | Hourly, five-minute grace if measured duration permits |
For optional learning alongside this configuration exercise, practise triaging alerts, assigning incident ownership and following response procedures.
Uptime monitoring FAQ
Which free uptime monitoring tool should I choose?
We list 24Observe first for teams that connect availability checks with investigation. It is built by our group, Networkers Home, so weigh our view accordingly. The Free plan includes 25 monitors, and deployment options include hosted and self-hosted. UptimeRobot suits teams that want externally hosted endpoint monitoring without maintaining the monitoring infrastructure themselves. Its free offering includes 50 monitors. Base your choice on the workflow and checks you need, with monitor count as one consideration.
Can I self-host uptime monitoring?
Yes. Uptime Kuma is a self-hosted tool with an MIT licence, suited to operators who want control over the monitoring environment. Include patching, backups, storage and notification testing in your assessment of operating costs. Where practical, run monitoring outside the failure domain being watched. If a host fails, a monitor on that same host cannot reliably report its disappearance.
How often should uptime checks run?
Start with the maximum time a failure can go undetected before someone must act. Allow for confirmation attempts and the time needed to deliver notifications. More frequent checks give you more observations, though unstable endpoints can generate extra noise. Check the cadence supported by your 24Observe plan before setting an alert policy, because intervals differ between plans.
Does HTTP 200 mean my website works?
No. A successful HTTP response can carry an error message or an empty application shell, even with status 200. Check for expected content alongside the status code. For 24Observe, HTTP and keyword monitors inspect the response body, while browser monitors assess content once JavaScript has executed. Choose a browser check if the content you need to verify appears only through client-side rendering.
How can I reduce false uptime alerts?
Review timeouts, firewall rules and the settings for confirming failures before extending alert delays. UptimeRobot confirms an initial failure using another data centre in the same region; this also applies to Free. Interpret regional evidence carefully, because a failure along one route may indicate a real local outage. Cross-region checking in 24Observe currently covers HTTP/HTTPS monitors. It does not extend to every monitor type.
How should I monitor scheduled jobs safely?
Have the job send its heartbeat when it completes successfully. Sending one at startup does not establish completion. In 24Observe, set heartbeatGraceSec above the maximum expected runtime. Adjust alertThreshold when paging should wait for consecutive misses. Treat the receive URL like a credential, since anyone holding it can report success. Exclude it from repositories, public configuration and logs. Validate the output separately, because the heartbeat establishes only that a completion signal was received.
Is uptime monitoring the same as real user monitoring?
No. Availability monitoring checks whether a service responds from the locations used for monitoring. Browser synthetics use controlled conditions to test specified rendered content or interactions. Real user monitoring measures actual visitors across the devices, networks and sessions they use. RUM is not currently available in 24Observe. When you need evidence of the browsing experience visitors actually receive, combine those visitor measurements with availability checks and synthetic tests.
Frequently asked questions
What is the difference between uptime monitoring and synthetic monitoring?
Uptime monitoring checks whether a service meets defined availability conditions. Synthetic monitoring uses scheduled, simulated activity, which can range from an HTTP request to a browser interaction. The terms overlap. A simple request can confirm that an endpoint responds, while a browser check can inspect content after JavaScript runs. Choose checks around the failure you need to detect rather than relying on the category name.
How often should I check my website's uptime?
Choose an interval based on service importance, acceptable detection delay and operational capacity. Faster polling creates more observations, but timeouts, verification and alert thresholds also influence when someone receives a notification. Estimate execution volume across monitors and locations before selecting a plan. For 24Observe, supported intervals depend on the plan; confirm the current allowance instead of assuming every monitor can use the shortest interval.
Which uptime monitoring tools have a free option?
The supplied facts establish free allowances of 25 monitors for 24Observe, 50 for UptimeRobot, and 10 each for Better Stack, StatusCake and Pulsetic. Better Stack also includes 10 heartbeats, while StatusCake's free uptime checks run every five minutes. These allowances are not interchangeable. Compare check frequency, execution limits, notification needs and status-page requirements before deciding which free option fits your service.
Why does a monitor report downtime when the website works for me?
Your browser and the checking location may take different network paths or receive different responses. Regional routing, access controls, timeouts and intermittent failures can produce different observations. Inspect the failed check before dismissing it. UptimeRobot verifies failures from another data center within the same region. 24Observe supports multi-region HTTP and HTTPS checks, but that coverage should not be assumed for its other monitor types.
Can a website return HTTP 200 and still be broken?
Yes. A server can return a successful status while displaying an error message, missing important content or failing to render a client-side application. A content assertion checks the response for expected text. A browser assertion can examine the rendered page after JavaScript executes. In 24Observe, these checks inspect different stages of the response. Neither should be treated as proof that every customer workflow succeeds.
How should I monitor a cron job or backup?
Use a heartbeat sent after successful completion, with an expected schedule and enough tolerance for normal runtime variation. In 24Observe, the grace period should accommodate slow job completion, and the failure threshold can require additional missed signals before paging. Protect the heartbeat URL because possession allows someone to mark the monitor healthy. Separately validate backup contents and restoration procedures; a received signal cannot establish recoverability.
Should I choose hosted monitoring or self-host an open-source tool?
Choose based on where checks must run and who will operate the monitoring system. UptimeRobot performs checks externally without requiring your own checking infrastructure. Uptime Kuma is self-hosted and MIT-licensed, so you control its deployment and carry the operating responsibilities. 24Observe offers hosted and self-hosted options. With any self-hosted design, consider whether the monitor shares the infrastructure failure it is supposed to detect.