Observability Platform · 24Observe
Observability platform guide: 10 platforms compared for 2026
Swipe sideways to see the whole diagram.
What is an observability platform, and how do metrics, logs, traces, and events fit together?
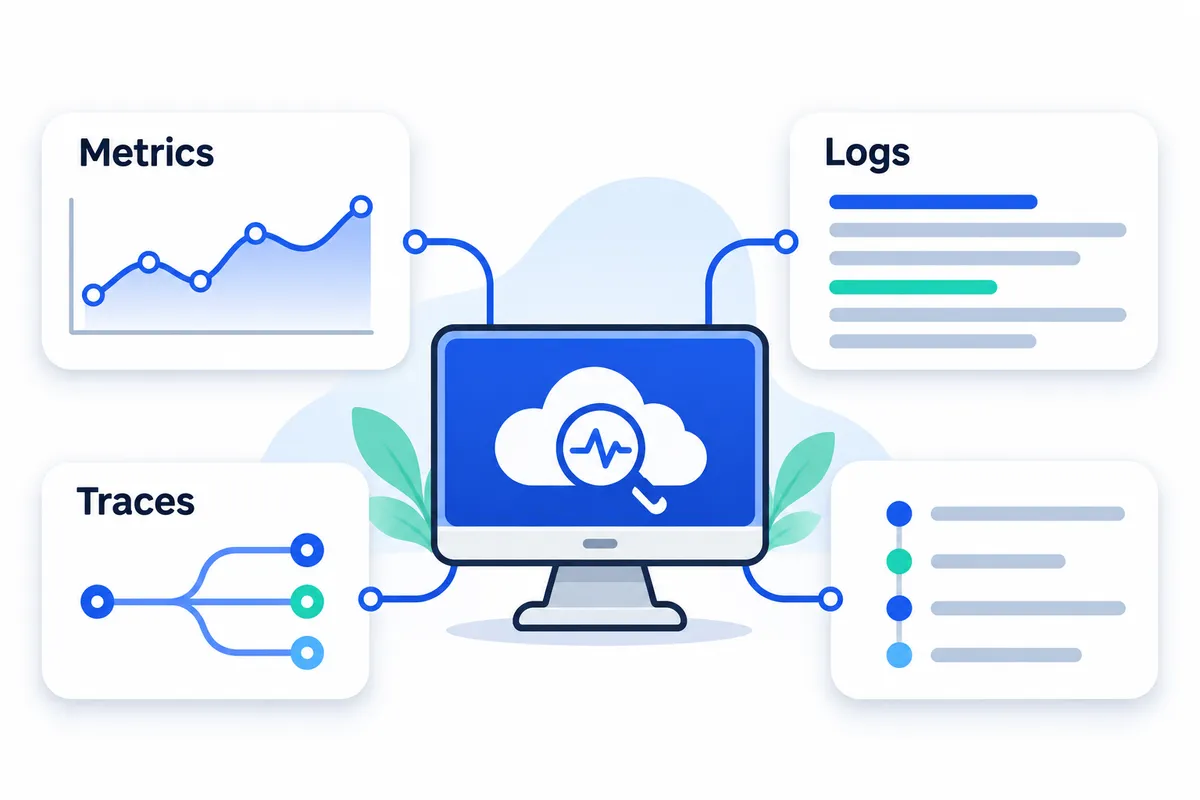
An observability platform collects and organizes system telemetry so engineers can investigate system behavior and service problems. Observability is the ability to understand a system’s internal behavior from the evidence it produces. In practice, that evidence needs to help explain a problem. Seeing that something changed is only the starting point.
When assessing an observability platform, focus on the evidence engineers need during an investigation. Keep general definitions separate from product claims, and ask whether the available records support an explanation. 24Observe is built by our group, so weigh our view accordingly. That relationship does not establish a product capability or validate an investigation’s conclusions.
Follow one slow API request
Imagine an API becomes slow while a deployment runs in the background. The release changes how the service accesses its database. Users experience delays, but an elevated response-time chart alone cannot explain the cause.
Each type of telemetry contributes different evidence:
| Evidence | Definition | What it contributes to this investigation |
|---|---|---|
| Metrics | Runtime measurements, usually examined over time | Request duration rises after the release, while traffic stays roughly steady. |
| Logs | Records of individual events | Application messages show database retries from the changed service, giving the engineer specific behavior to investigate. |
| Traces | Records showing the paths requests follow through an application | A slow request spends most of its duration waiting on database operations, narrowing the investigation to that part of its execution. |
| Operational events | Records of changes or occurrences relevant to operations | Deployment and configuration-change records establish what changed and when. |
Together, these views help reconstruct the incident. Metrics establish its scope and timing, while logs supply details of what happened. Traces locate the delay along a request’s path, and deployment records suggest an explanation the engineer can test.
For API monitoring, investigate response time alongside failures and request behavior. A slower response alone does not provide a complete diagnosis. Check whether the delay affects all requests or only those using the changed database access path.
Operational events and OpenTelemetry signals are different concepts
Engineers routinely use “events” to describe deployments, configuration edits, and service restarts. That operational meaning says nothing about whether a particular product ingests those records.
OpenTelemetry collects, processes, and exports telemetry. Its supported signals include metrics, traces, logs, and baggage, which carries context between signals. The supplied OpenTelemetry documentation identifies events as a specialized category of logs still being developed or proposed. Operational change records remain useful evidence regardless of how those signal categories are defined.
Shared context makes the evidence useful
Putting dashboards next to each other does not establish relationships between their records. Timestamps need consistent time zones and synchronized clocks. A service name must identify the same workload wherever it appears. Request context, such as a trace identifier carried into application logs, helps connect a specific failure to its execution path.
Without those connections, an engineer can mistake an unrelated deployment for the cause. Matching timestamps establish correlation; causation still needs evidence. Compare affected service versions with unaffected ones, then inspect the changed behavior and test the hypothesis.
This distinction matters when designing custom observability, examining alert fatigue, distinguishing monitoring from observability, or measuring recovery time. In each case, the evidence must support the explanation. An alert can identify a condition that needs attention without explaining its cause, and a recovery measurement can describe elapsed time without showing which action resolved the incident. Topic links do not substantiate product capabilities or establish an investigation’s cause.
How is observability different from monitoring?
Monitoring tells you whether a predefined check or threshold has failed. Observability helps you investigate why behavior changed, including questions nobody anticipated when building the dashboards. The practical monitoring and observability differences concern how you investigate. Both disciplines have a role. 24Observe is built by the Networkers Home group, so weigh our view accordingly.
| Dimension | Monitoring: routine checks | Observability: exploratory investigation |
|---|---|---|
| Question asked | Has API latency crossed its threshold? Did an uptime check fail? | Why are some requests slower, and what distinguishes them? |
| Evidence used | Defined checks, metric thresholds, dashboard trends | Relevant measurements, request paths, logs, and change events examined together |
| Action taken | Notify the responsible team and start the runbook | Test explanations, narrow the affected scope, and choose a mitigation supported by evidence |
Continue the API monitoring example: a latency alert fires because the endpoint’s p95 exceeds its configured threshold. The alert establishes the symptom; finding the cause takes investigation.
Compare latency across routes, regions, and application versions. Inspect request traces to find where affected requests spend time, then examine the corresponding log records for retries, timeouts, or errors. Check deployment events alongside infrastructure measurements from the same time window. If slow requests cluster around a new version, compare them with unaffected requests before attributing the problem to the deployment, since timing alone does not prove causation.
Telemetry needs enough operational context to be useful during an investigation. You need to connect records and filter by meaningful attributes so you can compare affected traffic with normal traffic. Missing request identifiers or inconsistent service names can make even abundant data difficult to investigate.
Dashboards and alerts remain essential starting points. Use what you learn during an investigation to update the dashboard, runbook, or alert where appropriate. Those changes can improve response and address alert fatigue. Track recovery time separately to assess whether the changes actually help responders.
Why does OpenTelemetry change how you buy observability tools?
24Observe is built by our group, Networkers Home, so weigh our view accordingly when using the linked guides.
OpenTelemetry separates how applications produce telemetry from where you analyse it. This open-source, vendor-neutral toolkit provides instrumentation and telemetry support for metrics, logs and traces. Your chosen observability backend handles dashboards and operational history; OpenTelemetry provides neither. Evaluate the instrumentation pipeline separately from the backend, then test compatibility between them.
Follow the data from application to backend
A typical OpenTelemetry pipeline has four parts:
- Instrumentation produces telemetry. Developers use OpenTelemetry APIs to instrument application behaviour, with instrumentation libraries covering common frameworks and libraries.
- A language SDK implements the APIs and supplies the export mechanisms the application uses.
- The Collector receives telemetry, processes it according to its configuration and exports the results to a destination.
- The backend stores the data and provides analysis through its own querying, visualisation and operational workflows.
Automatic instrumentation can produce telemetry without changes to application code. Setup requirements still depend on the runtime and framework. Before treating a demonstration as representative of your estate, check the instrumentation library, its supported environment and the configuration it requires. Record those details in your instrumentation plan, separately from the backend purchase.
Naming and context determine whether data remains useful
Semantic conventions standardise the names of common telemetry attributes. Teams should be able to describe the same service or operation consistently across applications, without inventing a naming scheme for each one. That consistency reduces the influence of local naming habits on cross-service investigations.
Context propagation passes request context between components. When an API request crosses several services, that context helps relate individual operations to the same journey. As part of validating API monitoring, verify that context survives each service boundary. Spans arriving at the backend are insufficient evidence that their relationships have survived.
Ask for evidence beyond an OpenTelemetry badge
Apply the same standard of evidence in your tool comparisons, whichever backend you evaluate. Ask every vendor these questions:
| Buying question | Evidence to request |
|---|---|
| Which signals are supported? | Separate documentation for metrics, logs and traces, including limitations. |
| Which protocols work? | Accepted protocols, including OpenTelemetry Protocol where applicable, and required exporters. |
| Which conventions survive ingestion? | A sample showing how attributes are preserved, renamed or mapped. |
| What does migration require? | Instrumentation changes, Collector configuration changes and backend-specific work. |
OpenTelemetry documents extension points, including custom exporters that serve backends without OpenTelemetry Protocol support. A working export route therefore does not establish native support for the protocol. If the platform documentation offers no evidence, mark support as unverified. Lack of documentation alone is insufficient grounds to call it unsupported.
Portability has a boundary
Portable instrumentation reduces reliance on vendor-specific collection. Dashboards, queries, alert definitions and retained data do not automatically move with it.
Test a backend change with representative telemetry before committing to a purchase. Assess the work needed to reconstruct dashboards, check alert behaviour and establish access to historical data. Then conduct an incident investigation in the destination backend. Data arriving successfully is one acceptance test; preserving a useful operational workflow requires a separate test.
How should you evaluate an observability platform before buying?
Evaluate an observability platform against a workflow your team must complete. A dashboard tour alone cannot establish whether it fits that workflow. Before the trial, define the investigation, required evidence, responsible engineer, and acceptable operating cost. Apply the same standard to 24Observe: it is built by our group, so weigh our view accordingly.
1. Signal coverage: verify what engineers can investigate
List the metrics, logs, traces, and operational events your workload requires. Document collection methods, searchable fields, retention, sampling, and export options for each. When testing collection and log investigation, have the evaluator show how representative records reach the system and become usable evidence. Verify each capability rather than inferring support from a general description.
Keep trace ingestion and application tracing separate in your assessment. Receiving trace records does not establish request waterfalls, service-level latency analysis, or code-level investigation. Have your application engineers specify the distributed tracing workflow they need, then ask for a demonstration.
2. Correlation: test relationships rather than shared screens
When assessing monitoring and observability, have the evaluator move from a symptom to related evidence without manually rebuilding every query. Which identifiers connect a service, host, deployment, log entry, and request? What happens when identifiers are missing?
For a proposed evaluation scenario, introduce a failed deployment across three test services and investigate the resulting errors. This is a buyer-designed exercise; it establishes no benchmark or product limit. Record the manual steps and identify who must maintain the tagging conventions.
3. Alerting and incidents: follow the response through handover
A notification confirms that a message arrived. Incident coordination also requires ownership, escalation, investigation notes, handovers, and a record of decisions. Establish whether those steps happen inside the platform or through another system.
When evaluating alerting, test trigger combinations, maintenance suppression, repeated notifications, and unacknowledged alerts. Record how the configuration addresses alert fatigue. For incident handling, examine who takes responsibility, how escalation works, and what the next responder can see. Before comparing response measurements, agree on timestamp definitions, including the events that mark each interval’s start and end.
4. Security coverage: separate protection from analysis
Assess platform security separately: authentication, role permissions, service-account access, audit evidence, data handling, and administrative boundaries. Ask who can query sensitive logs, change retention, or export records.
Then assess any proposed security-analysis capabilities against your SIEM requirements. Log search helps retrieve evidence; threat detection requires defined detection logic and an investigation workflow. Establish which functions the supplied evidence supports. Have analysts demonstrate a detection and explain its inputs, how it is tuned, and who owns the response.
5. Pricing model: model workload growth and operating effort
Request a written pricing estimate for normal operation and a proposed incident-driven surge:
| Cost variable | Question to resolve |
|---|---|
| Ingest volume | How does sending more telemetry affect charges? |
| Retained data | How do retention duration, storage, and retrieval affect cost? |
| Metric cardinality | How do additional label combinations affect series counts and resources? |
| Event volume | How does growth in recorded events affect the estimate? |
| Hosts and users | Do infrastructure growth or additional responders change commercial terms? |
| Operational labor | Who maintains collectors, queries, detections, upgrades, and storage? |
Use these variables to evaluate costs without assuming every vendor bills against them. Check current terms for included allowances, overage treatment, support, and data-export costs.
6. Self-hosting: name the operating owner
If a vendor offers self-hosting, treat it as an operational responsibility. Request deployment documentation covering dependencies, sizing assumptions, upgrades, backups, restoration, and failure recovery. Assign owners for patching and capacity planning. Before committing, test whether retained telemetry and configuration can be exported in usable formats.
Evidence to retain before approval
- Record the demonstrated workflow, including inputs, investigation steps, handovers, and unresolved dependencies.
- Keep deployment documentation covering the architecture, access model, retention settings, recovery procedures, and ownership assignments.
- Attach current commercial terms, a workload-specific estimate, and written assumptions.
- Mark unresolved items “not specified in the supplied evidence” and request clarification. Missing documentation does not establish that a feature is absent.
Which observability platforms suit broad operational monitoring?
A feature list tells you little about how an investigation will work. NOC engineers need infrastructure context; SREs need evidence of application failures. SOC analysts need to know which security capabilities are documented. Define the investigation your team needs to complete, then evaluate each platform against that requirement. When reading our monitoring and observability comparison, judge its claims separately from the product evidence presented here.
Each profile uses the same evidence categories. The sequence reflects an editorial decision; no independent comparative testing supports the order.
1. 24Observe
24Observe is built by our Networkers Home group, so weigh our view accordingly. This is our affiliation disclosure; the supplied fact sheet does not independently establish it. We list it first to disclose the connection before discussing alternatives. The fact sheet supplied for this section does not identify a best-supported use case. Ask for evidence tied to your operational requirements before assuming its features match those of the broader platforms discussed below.
There is insufficient product evidence in that fact sheet to describe 24Observe’s capabilities here. We make no product-specific claims about investigating application performance, the signals it supports, security functions, or integrations. The evidence also does not establish limits, deployment options, or pricing.
When evaluating any platform, check what operators can investigate after data arrives. Ingesting a signal alone tells you little about the questions an analyst can answer. Request an end-to-end demonstration that shows the evidence an operator receives and where the investigation reaches its limits. Product descriptions and architectural terms cannot establish whether that workflow meets your needs.
The fact sheet supplies no deployment details. Get written confirmation of which deployment model is available for your requirements.
It also provides no pricing evidence. Before comparing costs, request a current quote and a clear account of the units used for billing.
Begin your validation questions with the about page and listed product page, then send specific product enquiries. Request a demonstration using representative data and the operational questions your team needs answered. Evaluate claims in the linked Networkers Home article independently. Including that link does not, on its own, verify the product’s origins, who authored the article, or what the product can do.
2. Datadog
Datadog is a fit for teams evaluating application and infrastructure monitoring delivered as a service. Its documented workflows connect application performance with logs, network investigation, and incident coordination. This scope is relevant when several operations teams share responsibility for investigating a production incident. The fit assessment rests on documented coverage; it does not establish superiority through comparative testing.
The Datadog product overview describes integrations that bring together metrics and operational events. APM tracks requests across distributed systems and creates service summaries automatically. It also provides graphs and alerts covering error rates and latency percentiles, including p95 and p99.
Its logging functions gather records from applications, services, and platforms. During an investigation, analysts can navigate between logs, metrics, and request traces. Automated tagging and correlation add context, helping operators examine an infrastructure symptom alongside an application error.
Other documented capabilities cover the areas below. Check each against your environment; the available evidence does not establish coverage for every possible setup.
- Network monitoring spans on-premises estates as well as hybrid and multi-cloud environments. Correlation connects network and device information with infrastructure and applications.
- Incident management provides discussions around production data, snapshots of issues, notifications to teams, and records documenting remediation.
- Alerting accommodates multiple trigger conditions, with notifications sent through channels such as Slack, email, and PagerDuty.
- Datadog describes ongoing assessment of cloud and AI security risk, informed by context from workloads in operation.
Application and infrastructure monitoring use a service delivery model. You still need to establish how collection works in your estate and how data will be handled; the deployment description alone leaves those questions open.
No price appears in the supplied evidence. Ask for a quote that includes the capabilities you plan to test.
For validation, replay an incident representative of your environment. Check whether navigation between signals retains the correct service, environment, and investigation time window. Compare network visibility with your actual topology, and test security coverage against specific use cases. Our log management guide can help frame collection questions, while the alert fatigue guide provides a basis for reviewing notifications.
3. New Relic
New Relic warrants a look when teams need visibility across their stack and want to assess AI-assisted insights. The vendor’s observability overview describes coverage across the technology stack. Validate that positioning against the services you operate before treating it as evidence of fit.
The documented figures are more than 775 integrations available through quickstarts and more than 30 capabilities within the platform. Keep those counts distinct: the number of integrations says nothing about the depth of an individual capability. Neither count should be combined with the vendor’s separate integration-marketing figure.
The supplied evidence also describes built-in AI-powered insights. It provides no basis for judging their accuracy or the quality of an investigation, so their usefulness for your incident patterns needs testing.
Deployment information is absent from the supplied material. Confirm the delivery model directly, along with what data collection requires.
The source promotes a free entry offer covering 100 GB and one user. It supplies neither paid prices nor the conditions necessary to estimate production costs.
Start validation by selecting quickstarts that match your stack, then examine what they actually cover. Require AI-generated findings to identify the observable evidence supporting them. Keep the monitoring of AI systems separate from the use of AI to assist investigations, and set a consistent investigation benchmark before evaluation begins. Treat recommendations in our AI observability guide and MTTR measurement guide as separate material to assess alongside the product evidence above.
How do Grafana Cloud and Elastic Observability fit standards-based telemetry?
We list 24Observe first because our group built it, so weigh our view accordingly. This section examines Grafana Cloud and Elastic Observability.
Standards-based telemetry gives teams a common starting point. A useful comparison must also account for daily operations: can engineers retain the queries, connections and investigation methods they depend on? Before a pilot, document what you collect and which data sources you need. Write down the investigation steps your team must reproduce.
4. Grafana Cloud
Evaluate its open-standards foundation, connections to existing data sources and OpenTelemetry-native cloud offering against your team’s operational requirements.
Grafana Cloud brings operational observability together with incident response and AI-assisted workflows. Its open-source and open-standards foundation is relevant when a team already has monitoring tools it wants to keep. Since it can connect existing tools and data sources, start the evaluation with your connection requirements.
The package includes application observability, Kubernetes monitoring, SLO management and real user monitoring. SRE teams should test service behaviour as well as the Kubernetes environment behind it. Carry that test through the incident-response workflow instead of ending the evaluation at dashboard screenshots.
Test telemetry selection separately. Adaptive Telemetry removes data classified as unused; spend-management tools let teams review and adjust consumption. Check filtering against investigation requirements. Data that seems unnecessary in routine operations may matter during an unusual failure, and these controls establish no specific saving.
Grafana Cloud is the offering assessed here; this comparison makes no claims about other Grafana deployment models. The Enterprise offering lists Public Cloud, Federal Cloud and Bring Your Own Cloud deployment choices; confirm which plans include them. Pro starts at $19 per month, plus usage charges, so the starting charge alone does not represent the total bill.
For validation, ask: can engineers reproduce essential queries and dashboards with the required existing data sources, then investigate and respond to a representative application or Kubernetes incident?
Prepare an inventory of current tools and document on-call responsibilities, including alert-routing requirements. Bring examples of repeated or unactionable alerts. The pilot should test how engineers receive and assess notifications, then act on them, rather than checking only whether alerts fire.
5. Elastic Observability
Evaluate its support for log-intensive investigations and high-cardinality metrics, including how OpenTelemetry and Prometheus workflows fit alongside application tracing.
Elastic Observability handles telemetry from collection and transformation through correlation, investigation and presentation. Its schema-agnostic approach and native OpenTelemetry support are relevant to evaluations involving varied telemetry structures and existing instrumentation.
Logs provide a clear reason to shortlist it. Elastic supports log analysis at scale and applies machine learning to detect anomalous log behaviour. Check whether those findings help analysts separate actionable deviations from expected operational variation.
For metrics, its columnar time-series database is designed for high-cardinality workloads and supports exploration of that data. Prometheus workflows support ingestion through remote write and queries using PromQL in Kibana. Elastic APM tracks requests across APIs and microservices, allowing latency investigation down to code-level detail.
The supplied evidence specifies neither deployment options nor pricing. Confirm both directly with Elastic rather than inferring them from its other products.
For validation, ask: can analysts reproduce a familiar investigation, starting with a log anomaly, checking relevant metric dimensions and following an application trace? Check that required OpenTelemetry and Prometheus workflows remain available, and record query changes or manual steps.
Build the exercise around a representative incident, identifying the logs, metrics and traces needed to investigate it. Document the questions analysts must answer. Apply those same requirements to other shortlisted tools to keep the comparison grounded in operational needs.
When should you evaluate Dynatrace or Splunk Observability Cloud?
24Observe is built by the Networkers Home group, so weigh our view accordingly. We list it first to make that relationship clear; the order does not rank the platforms. Assess each platform against your observability requirements using a workload-specific test plan.
6. Dynatrace
Consider Dynatrace when investigations depend on understanding the relationships between applications and infrastructure. Smartscape automatically discovers those dependencies and builds a relationship map that gives telemetry context. Grail brings data together for contextual analysis. These capabilities suit teams that need dependency information to investigate application and infrastructure problems.
For distributed tracing, PurePath examines request timing with code-level context across distributed execution paths. Dynatrace also documents application monitoring, infrastructure monitoring and log analytics. Test these views against a known incident: do they explain what happened well enough to support your incident-resolution workflow?
Application Security and Threat Observability are documented solutions to assess where security investigations overlap with operations. Evaluate their specific coverage while keeping the distinction between SIEM and observability clear. Coverage in one area does not establish equivalent coverage in the other.
Separate collection from backend hosting in your evaluation. OneAgent runs on a host, continuously collecting relevant metrics along the application-delivery path. This explains how collection works. The supplied material leaves backend hosting options unspecified, so ask Dynatrace to confirm them directly.
Pricing is based on a single spending commitment, with discounts that increase with volume. Dynatrace says there is no penalty for exceeding that commitment and documents cost visibility and controls. Request a quotation based on your workload rather than estimating rates from that description.
Before choosing it, establish whether Dynatrace can accurately map your critical dependencies and explain a representative incident. Confirm that the proposed backend hosting meets your requirements and that the spending commitment is clearly costed.
7. Splunk Observability Cloud
Consider Splunk Observability Cloud when you want an OpenTelemetry-native approach to application and infrastructure investigations, particularly if your operational logs already reside in Splunk Platform. Its use of a common instrumentation standard makes it relevant to teams standardising telemetry collection.
Service Maps and Trace Analytics apply AI and machine learning to guide investigations. Application Performance Monitoring brings related information into visual investigation views. Database Monitoring helps pinpoint slow queries and connect them with application performance issues. For frontend performance, Splunk documents Real User Monitoring and Synthetic Monitoring. Infrastructure Monitoring provides real-time alerts; test their usefulness against your criteria for alert fatigue.
Check the log boundary explicitly. Through Log Observer Connect, investigators can examine application and infrastructure logs stored in Splunk Platform. Observability Cloud can correlate that analysis with live metrics and traces. This does not establish that Observability Cloud includes a Splunk Platform deployment, storage or entitlement. Account for those dependencies in your log-management assessment.
The supplied material does not specify hosting or deployment options for the product. Confirm them directly rather than drawing conclusions from its name. Assess its security coverage separately, too: capabilities documented elsewhere in Splunk’s portfolio should not automatically be attributed to Observability Cloud.
For the evaluation, use your actual OpenTelemetry instrumentation and Splunk Platform entitlements. Ask an engineer to investigate a service issue using traces, database evidence and existing logs. Then check that the proposal identifies every component needed to complete that investigation.
Why consider Honeycomb for high-cardinality investigations?
8. Honeycomb
Honeycomb suits exploratory investigations into telemetry with many distinct attribute values, including following requests across services and examining unexpected behaviour. Other tools also support high-cardinality analysis. Honeycomb’s appeal lies in its data model and investigation tools. For your evaluation, define the questions you need to answer and review how you currently use aggregate monitoring charts.
Structured events underpin Honeycomb’s approach. It derives logs, metrics and traces from these events, retaining relationships between the signals, and uses column-oriented storage designed for telemetry analysis. When evaluating it, examine the event structure and the context retained alongside each event.
Its investigation capabilities include:
- Trace waterfalls to inspect request paths and timing across services, a core workflow in distributed tracing.
- BubbleUp to identify outliers automatically and explore them through views of logs, metrics and traces.
- OpenTelemetry support for teams that use standards-based instrumentation.
A useful trial question is: why are requests failing for one customer segment when the aggregate charts look normal? Treat this as an illustrative investigation, without implying a customer result. Instrument representative API requests with attributes for the relevant segment, version and service. Check whether you can isolate affected events and use BubbleUp to examine outliers. Follow representative failures through trace waterfalls to assess the request-level investigation workflow.
Event volume determines pricing. According to Honeycomb’s documentation, additional fields carry no penalties, and adding users brings no hidden fees. The supplied evidence for Honeycomb contains neither specific rates nor deployment options, so confirm both as part of your evaluation.
Check whether your telemetry design retains enough context to answer questions that arise during incidents. Assess the trial against your observability requirements and incident investigation process. That assessment should include checking whether the attributes you need survive collection.
The linked background guides come from 24Observe, built by our group, so weigh our view accordingly. They provide context for this evaluation. They do not establish Honeycomb’s capabilities; verify product details in Honeycomb’s documentation and test them during your trial.
Which open-source observability tools can you self-host?
Disclosure: 24Observe is built by the Networkers Home group, our group, so weigh our view accordingly. For teams seeking open-source software they can operate themselves, SigNoz and OpenObserve deserve evaluation. Start with the investigation workflow you need, then assess the work required to keep the backend available.
9. SigNoz
SigNoz suits application teams that need an open-source backend with documented support for application tracing, log analysis, metrics, infrastructure monitoring, dashboards, and alerts. Its trace explorer helps investigate request activity. Teams can create and share dashboards or build them from templates.
The SigNoz documentation describes several self-hosting routes: Docker Compose, installation on Debian or Ubuntu, and Helm-based deployment into Kubernetes. SigNoz Cloud is an alternative for teams that prefer a cloud service to operating the backend themselves.
For an SRE evaluation, test whether application tracing answers a real latency question alongside the relevant logs and resource metrics. Assess that workflow directly rather than relying on a dashboard demonstration.
SigNoz also documents roles, service accounts, and SAML-based sign-in. Before making these access-control requirements, confirm their availability in your intended edition and deployment. Open-source availability does not mean every offering has the same feature coverage.
10. OpenObserve
OpenObserve is written in Rust and brings together log data, metrics, and distributed tracing. Support for SQL and PromQL makes it relevant to teams whose investigations span log management and metric queries.
Its documentation covers running it locally and deploying it on Kubernetes. The term “cloud-native” describes the architecture; it does not establish whether a managed-cloud offering exists.
OpenObserve documents ingestion pipelines that transform and route incoming data without coding. It also describes interactive dashboards built from data streams and notifications triggered by configured conditions. Teams can define alert conditions and notification channels. The documentation covers identity administration, resource-access controls, and storage configuration for ingested stream data and metadata.
It suits operators who want these query and ingestion capabilities in a self-hosted backend. During evaluation, send representative telemetry through a pipeline and inspect the resulting fields. Then build an investigation dashboard and deliberately trigger a notification to test the workflow.
What does operating either backend involve?
Running an observability backend adds responsibilities that belong in the evaluation budget. These are routine duties when operating either product yourself.
| Responsibility | What to establish before production |
|---|---|
| Upgrades | Assign an owner, rehearse changes outside production, and document a rollback procedure. |
| Retention design | Decide how long each signal remains useful, then account for that choice in storage planning. |
| Capacity planning | Test representative ingestion bursts, query concurrency, and growth assumptions as part of your observability design. |
| Recovery testing | Rehearse restoration and measure recovery time rather than assuming backups guarantee recovery. Include backend recovery in your MTTR planning. |
| Access administration | Assign responsibility for permissions, automation credentials, and removing access when people change roles. |
Include compute, storage, engineering time, and support needs when comparing operating costs. Before handing the service to an on-call rotation, verify alert ownership and test notification conditions against your alert-fatigue criteria. Base the comparison on the exact editions and deployment choices you intend to run. The “open source” label alone tells you neither which features are included nor what the service will cost to operate.
Observability platform comparison: which tool fits your workload?
24Observe is built by the Networkers Home group, so weigh our view accordingly. We list it first to disclose that relationship; the order does not indicate a ranking. Compare the signals each tool covers and the context it provides for investigations. Check deployment evidence and billing assumptions separately. Define your observability requirements before deciding whether uptime checks or request tracing belongs in the evaluation. Where a capability is unspecified, verify it rather than assume support.
| Platform | Strongest evidenced fit | Signal or investigation scope | Deployment evidence | Pricing basis or evidence gap |
|---|---|---|---|---|
| 24Observe | Requires verification | Signal coverage and investigation capabilities require verification | Not specified | Not specified |
| Datadog | Infrastructure and application monitoring | Metrics, logs and request traces; APM | Monitoring as a service | Not specified |
| New Relic | Stack-wide visibility | AI-assisted insights across the stack | Not specified | Free entry: 100 GB, one user; paid model unspecified |
| Grafana Cloud | OpenTelemetry-oriented operations | Observability, incident response and AI workflows | Cloud; Enterprise: Public Cloud, Federal Cloud, Bring Your Own Cloud | Pro: $19/month plus usage |
| Elastic Observability | Large-scale log investigations | Logs, APM and OpenTelemetry workflows | Not specified | Trial documented; pricing model unspecified |
| Dynatrace | Application-infrastructure relationship mapping | Topology, metrics, logs and distributed traces | OneAgent instruments hosts; backend hosting unspecified | Commitment with volume-based discounts |
| Splunk Observability Cloud | OpenTelemetry-based stack troubleshooting | APM; connects logs held in Splunk Platform | Named cloud offering | Free edition: 15 hosts; paid model unspecified |
| Honeycomb | High-cardinality investigations | Cross-service requests and structured telemetry | Not specified | Event-volume billing |
| SigNoz | Open-source application observability | APM, traces, logs and metrics | Self-hosted or SigNoz Cloud | Not specified |
| OpenObserve | SQL/PromQL-oriented telemetry analysis | Logs, metrics and traces | Local operation or Kubernetes | Not specified |
Missing evidence leaves a capability unverified; it does not establish that the capability is absent. Host instrumentation also tells you nothing about where the vendor hosts its backend.
The documented billing models do not provide equivalent workload estimates, so they cannot support a total-cost ranking. When planning a replacement, build evaluation tasks around your actual log investigations and alert-handling requirements. Include your incident recovery measures in that evaluation. Test each candidate against those tasks, then check retention needs and deployment constraints before deciding.
Can one platform support NOC, SOC, and SRE work?
Yes, if teams share evidence while keeping their responsibilities clearly separated. A common console alone cannot provide that separation.
Consider a checkout service becoming unavailable after a firewall change. Authentication logs also show unusual access to the administrator account responsible for that change. The events may be connected, but their timing does not establish causation.
| Team | Investigative responsibility |
|---|---|
| NOC | Confirm service availability through uptime checks, inspect network reachability, and establish the affected scope. |
| SOC | Investigate the authentication activity, test whether access was authorised, and assess possible compromise using relevant log evidence. |
| SRE | Analyse the change, dependencies, and request failures; assess reliability impact and validate recovery. |
Investigators can connect their work through shared service identifiers, host identities, account names, and change references. A consistent timeline helps separate preceding events from consequences. Clear response ownership and linked incident records can preserve the evidence and decisions behind recovery actions while keeping each team’s authority distinct.
Verify scope rather than assuming equivalence
We discuss 24Observe first because our group built it, so weigh our view accordingly. Assess its suitability on evidence, independently of that relationship. Start with questions about scope, telemetry, context, logs, detections, administration, incident handling, and deployment. The supplied addresses, 24Observe features, 24Observe concepts docs, 24Observe context docs, 24Observe logs docs, 24Observe detections docs, 24Observe admin docs, 24Observe incidents product page, and 24Observe self host, are unverified here. Their inclusion does not establish their contents, supported capabilities, or deployment options. Require evidence for each capability your team needs; product terminology alone cannot establish what a deployment supports.
For Datadog, teams evaluating infrastructure, application, network, and security monitoring should establish which requirements the proposed deployment covers. Request a demonstration showing how investigators connect evidence and preserve response actions. Check the deployment model and responsibility boundaries against your operating environment before deciding whether it fits.
For Dynatrace, teams assessing application security and dependency-aware investigations should test those tasks in the proposed deployment. Examine the relationship information available to investigators, how they use it, and where its scope ends. Product terminology and a demonstration of one workflow cannot establish equivalence across every NOC, SOC, and SRE requirement.
Shared telemetry alone cannot establish SIEM functionality, detection quality, security-data retention, or application tracing depth. Assess each separately. Keep security-event investigation distinct from operational troubleshooting, and verify the application-level evidence available. Have each vendor demonstrate the checkout-service scenario, including permissions, evidence preservation, and handoffs. Document who can investigate, who can approve changes, and who validates recovery.
If you want structured study alongside this evaluation, look for SOC analyst or cybersecurity training covering evidence assessment and incident responsibilities. The syllabus should also address the distinction between monitoring and security investigation. Check that these subjects are included before choosing a course.
How do you test a Datadog alternative before migrating?
Test the candidate with a workload pilot. Agree on pass criteria before configuration.
- Define the investigations and inventory your instrumentation. List the questions responders must answer, then map your existing agents, SDKs, collectors, tags and sampling settings. OpenTelemetry handles telemetry collection and export; you still need a backend for storage and visualization.
- Reproduce a representative failure in staging, such as a slow dependency or an application error. Check whether responders can connect metrics with application logs and request paths through consistent service identifiers and timestamps. Document any missing relationships.
- Test the response workflow, including alert ownership, acknowledgement and handoff. Inspect incident records for preserved evidence and responder actions, along with the response timeline.
- Check access boundaries and portability. Use separate identities to attempt both permitted and prohibited access. Verify export paths and retention requirements. Measure how much work it takes to recreate important dashboards and queries.
- Calculate costs from measured usage. Capture telemetry volumes in normal operation and during the injected failure. Apply the candidate’s billing dimensions and account for retention needs, infrastructure costs, migration work and ongoing administration.
24Observe is built by our group, so weigh our view accordingly. That connection is why we name it first. For each candidate, translate investigation requirements into documented acceptance tests. Require a pilot demonstration if distributed request investigation is mandatory. Keep migration requirements separate from functionality demonstrated in the pilot. Related telemetry capabilities alone are insufficient evidence that a candidate can replace your team’s workflows.
When evaluating 24Observe, independently test collection, logs, metrics, alerting, incident handling, access boundaries and export paths against your requirements. Treat these links as starting points for verification, not evidence that a requirement has been met. Record what the pilot demonstrates and what remains unverified.
For migration documentation, SigNoz covers paths from Datadog, Grafana and New Relic. OpenObserve documents how to route Datadog Agent, DogStatsD, APM and log data. Those routing instructions do not establish full feature equivalence or show that migration will be simple.
Complete this decision worksheet before approving the migration:
| Required capability | Demonstrated evidence | Unresolved questions | Operational owner |
|---|---|---|---|
| Required investigation | Saved reproduction and findings | Missing signal relationships? | Service owner |
| Alerting and incident history | Handoff test and incident record | Ownership gaps? | On-call lead |
| Access, retention and export | Permission tests and exported sample | Policy gaps? | Security owner |
| Dashboards, queries and cost | Rebuild timings and volume-based estimate | Unmeasured effort or usage? | Platform owner |
Frequently asked questions about observability platforms
What is an observability platform?
An observability platform helps engineers investigate system behaviour through telemetry. Metrics measure runtime activity, logs record events, and traces show how requests move through applications. Each signal offers a different view of the system. Useful investigations depend on consistent instrumentation and enough context to connect evidence across services.
How is observability different from monitoring?
Monitoring checks defined conditions, such as availability or an error threshold. Observability helps engineers investigate why behaviour changed, including failures they had not anticipated when setting up alerts. The distinction between monitoring and observability concerns how teams investigate systems; dashboards alone do not establish it. Most operations teams need both, using monitoring to detect trouble and observability to investigate the cause.
Is OpenTelemetry an observability platform?
Evaluate OpenTelemetry by separating instrumentation and telemetry transport from storage and analysis. Identify which components receive telemetry, process it and send it onward. Then establish which backend stores the data and provides visualisations. Treat instrumentation and the analysis backend as separate decisions. Standards-based instrumentation can make it easier to change destinations, while backends still differ in their querying, retention and investigation workflows.
Which observability platform is best?
The best choice depends on your team’s requirements. 24Observe is built by our group, so weigh our view accordingly. We list it first to make that affiliation explicit, rather than imply a ranking. Compare investigation workflows and verify each candidate’s scope. Base your selection on actual investigations, the deployment model you need, who will operate it and measured costs. Test the workflow you expect to use; products carrying the observability label can have different capabilities.
Are there open-source observability platforms?
Yes. If you are considering SigNoz or OpenObserve, check which telemetry signals and deployment options each offers. The open-source label alone establishes neither. Decide whether your team wants to operate the backend or have a provider manage it. Assess each option against the investigations you need to support and the operational responsibilities your team can take on. With self-hosting, your team remains responsible for capacity planning and upgrades, as well as backups and incident ownership. Open-source licensing leaves that operating work in place.
Can an observability platform replace a SIEM?
Replacement depends on the security requirements. A SIEM focuses on analysing security events and detecting threats, while observability usually focuses on system behaviour and service health. The two can share telemetry, but collecting security logs alone does not establish suitability as a SIEM. Evaluate the detection logic and evidence available for investigations. Check access controls and retention requirements explicitly. The SIEM versus observability distinction matters when SOC and SRE teams use shared data while retaining different responsibilities.
How should we compare observability platform costs?
Use the same workload and signal mix for every comparison, with matching retention periods and investigation requirements. Establish what each quote meters, then estimate usage during normal operation and incident-driven telemetry increases. Account for backend administration and migration work alongside subscription charges. When evaluating alternatives, test your estimate against representative data. Assess operating cost separately from entry price, since a cheaper starting point may cost more to run. Check investigation fit separately too: cost controls alone do not establish that a platform meets your needs.
Frequently asked questions
What is an observability platform?
An observability platform brings system telemetry into workflows that help engineers understand behavior and investigate problems. Metrics describe measurements, logs record events, and traces follow requests through applications. The useful distinction is whether engineers can connect relevant evidence and ask new questions during an investigation. Evaluate that workflow directly rather than assuming that several dashboards provide equivalent investigative depth.
What is the difference between monitoring and observability?
Monitoring typically checks known conditions, such as whether a service responds or a metric crosses a threshold. Observability supports investigation into why a system behaves a particular way, using telemetry and its context. Teams need both: an alert can identify a symptom, while related signals help investigate the cause. The distinction concerns the questions a workflow supports, rather than whether it contains charts.
Is OpenTelemetry an observability platform?
OpenTelemetry provides open-source tools and standards for instrumentation and telemetry collection. Its components can generate, receive, process, and export signals, but it does not provide the backend that stores and visualizes them. Teams still select a destination for analysis. Its vendor-neutral approach helps separate instrumentation choices from backend selection, although that does not automatically make every dashboard or investigation workflow portable.
Is 24Observe an APM or distributed tracing product?
No. 24Observe is built by the Networkers Home group, so weigh our view accordingly. Today, it is neither an APM product nor a distributed tracing product. It ingests traces as a signal feeding its context graph. That distinction matters when request-level performance investigation is mandatory. Trace ingestion alone should not be treated as evidence of an APM investigation workflow.
Which open-source observability platforms can be self-hosted?
SigNoz and OpenObserve are open-source options with documented deployment choices. SigNoz supports self-hosting, including Docker Compose and Kubernetes installation through Helm, and also offers SigNoz Cloud. OpenObserve can run locally or on Kubernetes and combines logs, metrics, and traces. Evaluate operational responsibilities alongside features: deploying a backend does not remove the work of managing capacity, retention, access, upgrades, and recovery.
How should I compare observability platform costs?
Compare costs against a representative workload and the vendor's documented billing model. Honeycomb uses event volume, Grafana Cloud Pro has a starting charge plus usage, and Dynatrace describes a commitment-based model. These are different purchasing structures, not directly comparable totals. Include retention needs, operational labor, and required capabilities in your evaluation, and avoid estimating savings without measured usage and current commercial terms.
Can an observability platform replace a SIEM?
Do not assume that collecting operational logs establishes the security workflows your SOC needs. Investigate detection coverage, investigation context, access boundaries, retention requirements, and incident handling separately. Some platforms document security capabilities, including Datadog's runtime-context risk assessment and Dynatrace's application-security and threat-observability solutions. Those facts do not establish that every security requirement is covered or that a particular SIEM can be removed.