Log Management Tool · 24Observe
log management tool guide: compare 10 options for 2026
Swipe sideways to see the whole diagram.
What does a log management tool actually do?
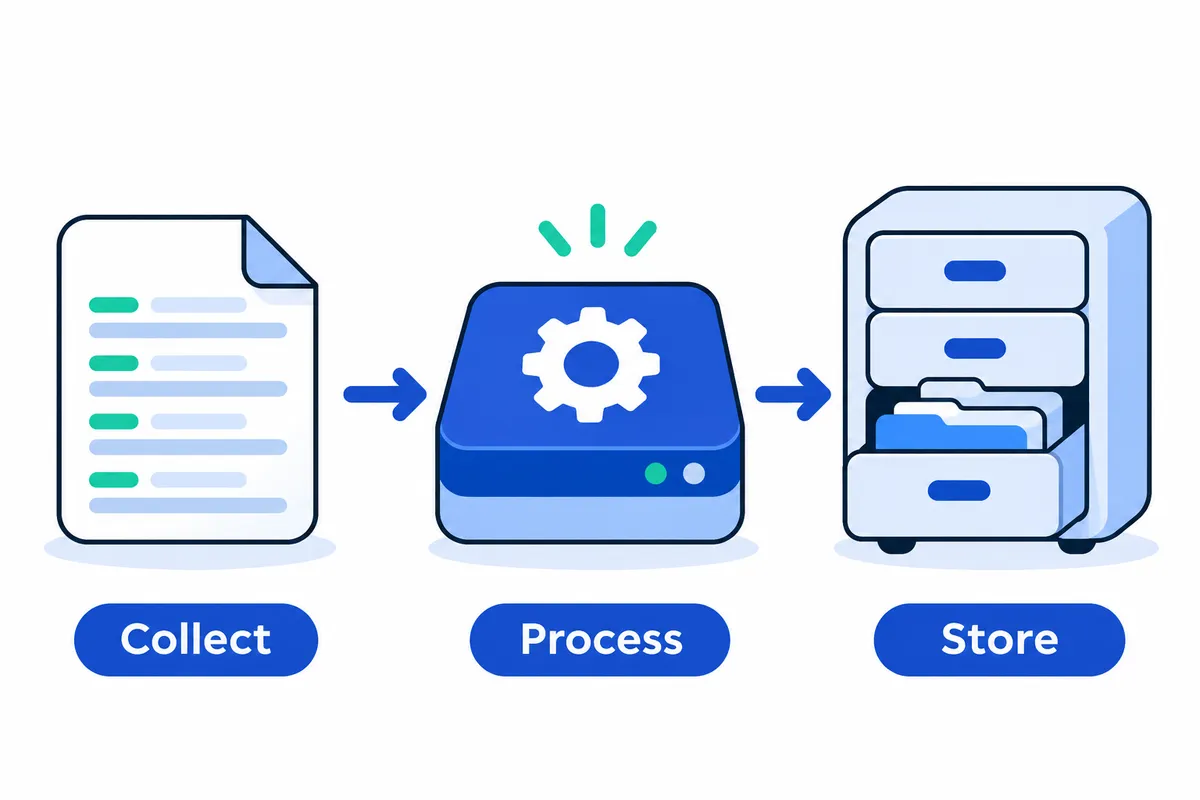
A log management tool gathers event records from applications and systems, converts them into usable data, and makes them available for searches and alerts. It also manages how long records are kept and whether older data goes into an archive. Each responsibility has its own failure modes.
Vikas Swami founded Networkers Home in 2007. We evaluate logging workflows against the questions engineers face in a NOC, SOC or SRE role, treating collection, investigation and retention as separate concerns.
For background, read the log management explainer from 24Observe, built by our group, so weigh our view accordingly.
Follow one authentication event through the pipeline
We will follow a hypothetical event throughout this guide: a failed SSH login for user maya on auth-01, coming from 203.0.113.24 at 09:15 UTC. This example does not describe a customer incident.
The table follows the event through a logging workflow. Individual products may support only some of these stages.
| Stage | What happens to our example | Distinct failure mode |
|---|---|---|
| Collection | An agent, receiver or forwarder carries the authentication record from the source. | Delivery fails when a forwarder stops or its buffer fills. |
| Parsing | The message is split into fields: timestamp, username, source IP and authentication result. | A message-format change causes fields to be misassigned or values to remain unparsed. |
| Enrichment | Ownership details or IP context help explain the failed login. | Outdated reference data links auth-01 to an incorrect owner. |
| Indexing | The system builds structures from selected fields, labels or message content to help locate records. | Poor indexing choices make an important investigation costly or difficult. |
| Search | An analyst finds the event by time, host, user or message content. | The wrong filter or time window conceals a successfully collected record. |
| Alerting | A rule checks whether the login needs attention, possibly in combination with repeated failures. | A badly set threshold generates noise; a notification failure keeps responders unaware. |
| Retention | Policy sets the authentication record’s expiry. | Wrong expiry settings delete evidence too early or keep it longer than policy allows. |
| Archiving | A copy is preserved in storage for later retrieval. | The copy becomes unusable if objects are missing, permissions block access or retrieval procedures are inadequate. |
Storage, analysis and security detection are different
Keeping data does not guarantee that you can search it immediately. Some systems index fields or message content; others index labels, then scan the matching data. Searching archived records may involve restoring them, replaying them or using a separate query path. Retention also depends on a working deletion mechanism. A configured duration is no proof that records are actually deleted.
A log viewer mainly lets you display and filter records. Log analytics helps examine relationships, patterns and aggregates, while log management covers the wider data lifecycle. A SIEM provides detection and correlation workflows focused on security. Finding an authentication failure in search provides no evidence that the product can correlate security events.
We describe products using only the supplied evidence and flag deployment or edition details that remain unclear. For example, the About page for 24Observe says hosted plans exclude application-log ingestion, although the logging documentation covers ingestion capabilities. Confirm hosted availability before evaluating it for that use.
Why does centralized logging matter for NOC, SOC and SRE teams?
Incidents often span systems owned by different teams. A failed connection may involve a router event, an authentication decision and an application timeout. Bringing those records into a shared investigation lets engineers compare evidence without repeatedly requesting exports from another team. Each team still has its own questions: NOC teams investigate connectivity, SOC teams examine security activity and SRE teams investigate service failures.
| Team | Investigation need | Evidence to connect |
|---|---|---|
| NOC | Follow device changes and connectivity failures. | Interface transitions, routing events and firewall decisions associated with the affected device or path. |
| SOC | Examine identities and suspicious activity. | Authentication attempts, privilege changes and access events associated with an account, host or IP address. |
| SRE | Investigate service failures. | Application errors, host events and dependency failures associated with the affected service or request. |
Make cross-system evidence trustworthy
Consistent timestamps help establish the sequence of events. Normalize time zones, preserve the original event time and distinguish it from arrival time. Clock differences can make a consequence appear to precede its cause.
Investigators also need reliable source identities. A hostname alone may be ambiguous across environments. Preserve device, host, service and environment identifiers to avoid joining unrelated events.
Make account names, IP addresses, service names and request identifiers queryable wherever available. Matching a specific identity across sources provides stronger evidence than finding the same phrase in message text.
Control access according to operational need. Logs can contain credentials, session tokens or personal information, so restrict both collection and viewing. Teams can share an investigation without giving everyone unrestricted visibility.
Missing evidence remains a problem after centralization. A stopped forwarder, parser failure or uncollected device can leave an apparently quiet timeline. Monitor collection health, investigate unexpected silence and check clock synchronization. Exclude or mask sensitive data before making logs more broadly accessible.
How shared context works in 24Observe
24Observe is built by our group, so weigh our view accordingly. Its monitoring, observability and SIEM capabilities use a common storage model and a shared set of incidents. Engineers can search network-device records alongside host and application logs using the same query language.
The entity graph links user accounts, hosts and IP addresses across incidents. Those connections support blast-radius investigation and grouping alerts around a common root. A scheduled context engine builds relationships from logs, traces, assets, monitor data, incidents, on-call information and audit records. Traces serve as evidence within that graph.
Shared storage still requires role-based permissions. The founder’s account of building the platform describes the motivation behind it: reducing the complexity of operating separate tools for monitoring, security and investigation.
Which log formats and shippers should you use?
Choose the event structure separately from the delivery path. An event format defines the record. A transport protocol carries it, while a collector or shipper reads, processes and forwards events. The indexing backend stores records and builds the structures needed to retrieve them. Format support alone tells you nothing about delivery reliability.
Match the format to the source
A JSON object describes an event using named fields, such as timestamp, severity, service and message. When you control the application, prefer structured output. Explicit fields make you less dependent on parsing message text.
NDJSON puts each JSON record on a separate line, giving streaming and file-processing tools clear event boundaries. Escape newlines within message strings so a stack trace does not split a record.
Syslog messages contain a header and message body and commonly come from network equipment and operating systems. Evaluate the message layout separately from the transport. UDP, TCP and TLS each bring different delivery and security considerations.
OpenTelemetry logs follow a common record model with a body, timestamps, severity and attributes. Resource information identifies the service or host that emitted the event. OTLP carries telemetry between components, but a claim of “OpenTelemetry supported” does not specify the receiver, transport or encoding.
Evaluate the shipping path under failure
Keep an existing collector if it has approved access, maintained parsing rules and someone responsible for operating it. Adding another host agent means taking on packaging, upgrades and troubleshooting. A central collector can also bridge sources where an agent cannot run.
Evaluate the complete pipeline with the questions below. Do not assume every shipper or backend behaves the same way.
| Concern | Evaluation question |
|---|---|
| Multiline exceptions | Does one exception remain one event without merging unrelated requests? |
| Timestamp parsing | Are timezone offsets, fractional seconds and missing timestamps handled predictably? |
| Severity mapping | How are numeric priorities and labels translated without changing their meaning? |
| Buffering | Is queued data held in memory or on disk, and what survives a restart? |
| Retry behavior | Which failures trigger retries, with what backoff and stopping conditions? |
| Backpressure | When the destination slows, does collection pause, queue or discard events? |
| Duplicate delivery | Can retries replay accepted records, and how will you identify duplicates? |
Apply the deployment boundary in 24Observe
24Observe is built by our group, so weigh our view accordingly.
Hosted 24Observe plans exclude application-log ingestion. Application-log walkthroughs in this section apply only to an explicitly self-hosted evaluation.
The documented inputs include JSON, NDJSON, syslog and OpenTelemetry logs. Use the log ingestion documentation and keep permissions separate: ingestion needs logs:write, while reading and tailing need logs:read. Consult the ingest-token guidance when choosing scopes.
According to the Sensor documentation, journald collection and delivery of host metrics over OTLP are defaults. Optional Sensor profiles cover container output, web-server logs, audit events and forwarded syslog. If you already have an OpenTelemetry pipeline, need gRPC ingestion or have legacy inputs, follow the recommended collector route in the collector documentation.
Check the deployed version and receiver before choosing an OTLP encoding. The API reference describes a v1 receiver limited to JSON, with protobuf translated by a collector. The collector documentation says both encodings are accepted directly. Those descriptions conflict. Send a test request to confirm what the deployed receiver accepts before configuring exporters.
For the self-hosted application-log evaluation, send a structured event and a multiline exception. Interrupt the connection, then repeat delivery. Compare the received events with the source records, checking event boundaries, timestamps, severity and duplicates.
How does ingest enrichment turn raw logs into investigation context?
Ingest enrichment helps investigators make sense of events, provided the source observation stays separate from its interpretation. Take a hypothetical SSH authentication failure: user mira, host bastion-1, and a public IP address as the source.
Keep the purpose of each operation clear:
- Preserve the source message and its timestamp so investigators can check exactly what was reported.
- Normalize extracted values into fields with consistent names and data types.
- Enrich the event with information from other sources, keeping those additions distinct from the original record.
What does each enrichment add?
| Element | Meaning and investigative use |
|---|---|
| GeoIP | Provides an estimated geographic location for an IP address. That estimate concerns the origin of network traffic; it cannot establish a person’s physical location. |
| IP reputation | Supplies reports of earlier activity linked to an address, including scanning or abuse. Assess its value against the age and quality of the source. |
| Indicators of compromise | IOCs include addresses, domains and hashes linked to activity suspected of being malicious. A matching event has a connection to intelligence that still needs assessment. |
| Elastic Common Schema fields | ECS specifies common names and data types for fields. Relevant examples here are source.ip, user.name, host.name and event.outcome. These fields structure observations and supply no threat intelligence themselves. |
Normalization makes the event searchable by identity, host, source address and failed outcome. A GeoIP lookup could place the address in a country missing from Mira’s previous activity. Reputation checks and IOC lookups could supply warnings. A change in geography or a matching indicator is insufficient evidence of compromise. Review VPN usage, shared outbound connections, travel and nearby authentication events before reaching a conclusion.
How 24Observe connects enrichment to investigation
24Observe is built by our group, so take that connection into account when weighing our view. We list it first because it brings ingest context together with relationships between entities.
The platform’s ingest enrichment applies GeoIP, IP reputation, IOC matching and ECS fields as logs arrive. You can also supply private indicators for supporting evidence. Its normalization coverage spans authentication events and web-access logs. Common authentication records from OpenSSH and access records from nginx or Apache get ECS-style fields.
Through the context graph, investigators can follow connections between hosts, identities and addresses across incidents. In Mira’s case, those connections help investigate whether other accounts were targeted, which hosts were affected and whether successful logins followed. This relationship context extends the investigation. An address shared by two entities still does not establish common ownership.
Keep the Elastic comparison specific. Elastic describes automatic import mapping to ECS and normalization of logs through OpenTelemetry schemas and semantic conventions. Those descriptions provide no assurance that the products have matching schemas, equivalent parser coverage or detections that transfer between them.
What should you verify?
Work through the log ingestion documentation with representative events:
- Check the age and expiry of intelligence feeds before relying on a match.
- For private addresses, use internal asset information; public GeoIP cannot provide meaningful attribution.
- When fields are missing, establish whether the value was unavailable or parsing failed.
- Record provenance: the provider of the enrichment, when the lookup occurred and which parser version was used.
- Limit sensitive identity and location details, control access, and retain original records with appropriate protections.
Which log analysis tools support search, live tail and error investigation?
Evaluate each investigation mode separately. A scrolling log viewer shows incoming events, but that alone tells you little about how the tool handles historical searches or recurring errors.
Separate the four investigation modes
| Mode | When it helps | What to inspect |
|---|---|---|
| Historical search | Reconstructing an incident within a defined period | Original messages, timestamps and event attributes |
| Live tail | Watching new events during reproduction or after a change | Newly arriving matches, rather than the historical record |
| Pattern grouping | Finding repeated message shapes or identical lines | Which messages dominate and which deserve closer inspection |
| Error fingerprinting | Tracking recurring exceptions | Stack-trace groups, occurrence totals and observation times |
Treat repeated message templates and repeated stack traces as distinct investigation objects. A template captures recurring activity, such as authentication rejections where the username changes. A stack trace records the execution path of an exception. Two exceptions can have similarly worded messages without sharing a failure path. Likewise, an operational message can recur frequently without containing an exception.
Use a reproducible investigation workflow
Start with the time window around the reported symptom, then filter for the affected service and severity. Before grouping anything, read the original events. Check the timestamps and attributes alongside the messages to see whether they support your working explanation.
Group repeated events to identify dominant messages and recurring exceptions. Then use live tail while reproducing the issue or checking a change. Keep the investigation filters intact so that historical search and the live view address the same question.
How the tools support this workflow
We put 24Observe first because it brings these investigation modes together. It is built by our group, so weigh our view accordingly. Teams willing to run their own installation can use its self-hosted option.
24Observe offers text and structured searches, with word matching, substring searches and KQL-lite filters. You can filter results by time, service and level. Its automatic facets surface level, host, service, source and attributes with primitive values, without schema declarations or index configuration.
Line-pattern grouping brings identical log lines together. Stack-trace fingerprinting separately groups recurring errors and displays occurrence totals, first and last observation times, and a sample message. See the error tracking documentation for that workflow.
Live tail selects incoming matches using the same syntax as historical search. When evaluating it, account for reconnection: streaming connections end after 30 minutes, and clients need to reconnect.
Elastic fits pattern-led investigations. It groups logs into patterns automatically and calls out anomalies and spikes. Elasticsearch underpins its log analytics stack, which suits teams analysing structured and unstructured logs. Check the hosting arrangement for the specific offering you are evaluating.
Grafana Loki fits investigations organised around labels. LogQL uses labels to select streams, with further filtering available. Logs Drilldown lets analysts explore patterns and errors visually without writing queries. Teams can run Loki themselves or use Grafana Cloud; those choosing self-managed operation maintain the stack.
Datadog’s Live Tail supplies a stream of live events. Its SaaS-only model suits teams that want managed infrastructure and already use Datadog to investigate logs alongside other telemetry.
New Relic’s logs workspace includes attributes, patterns, queries and live tail. Logs reach New Relic through agents or other forwarding paths. It suits teams investigating application issues together with host problems. Verify the hosting requirements when selecting an offering.
Questions to test before choosing
Use the test guide alongside these questions to organise your evaluation:
- Can the analyst role you intend to use access historical results as well as live tail? In 24Observe, each requires
logs:read. - How does the tool behave when a selected field, such as service or severity, is missing?
- Does the same filter behave consistently in historical searches and live views?
- Can an analyst open the original events from a group?
- How will you check for events missed during reconnection?
How do you build log monitoring alerts without unnecessary pages?
Start with the action an engineer should take. A threshold rule counts matching events within an evaluation window. Grouping determines whether that count applies to a service, host, account or another dimension. Page only when the condition requires immediate intervention, and keep lower-urgency findings for review.
Define the condition, owner and recovery test
Before enabling notifications, specify:
- Threshold: What count or rate warrants investigation?
- Grouping dimensions: Which entities need separate investigation? Avoid turning every request identifier into another alert.
- Evaluation window: How much history should each evaluation inspect? Test brief bursts and sustained failures separately.
- Baseline comparison: Does the increase remain unusual after accounting for normal traffic variation?
- Ownership: Assign a responsible team, an on-call response procedure and a runbook.
- Recovery: Define what healthy means and verify that the incident clears when that state returns.
These are hypothetical test designs. Check whether the product supports each configuration before testing:
| Scenario | Recommended rule experiment | Noise and recovery checks |
|---|---|---|
| Authentication failures | Test 20 failures within five minutes, grouped by account and source IP. | Replay ordinary password mistakes and a concentrated attack simulation. Confirm that activity falling below the threshold permits recovery. |
| Application errors | Test an error ratio above 5% over ten minutes, grouped by service and environment. | Compare against request volume and normal traffic. Verify behaviour when requests stop, then when successful requests resume. |
| Missing expected events | For a job expected every 15 minutes, test an absence condition after 20 minutes without its completion event. | Stop the job, then separately interrupt shipping. Resume delivery and check recovery; missing logs alone do not establish which component failed. |
Separate documented detection behaviour from recommendations
We discuss 24Observe logs first because log detections feed its shared incident workflow. It is built by our group, Networkers Home, so weigh our view accordingly.
The detection documentation describes search-compatible rules with filtering, text matching, grouping and aggregation. Documented volume alerts include fixed thresholds and anomaly comparisons. The anomaly comparison calculates a ratio against a seven-day reference window and triggers at a threefold increase. This calculation uses a ratio rule without machine learning; see the log documentation.
A matching log-alert threshold opens an incident and emits log_alert.fired. Supported log-alert notification channels currently include email, webhooks, Slack, Discord, Microsoft Teams and Telegram. PagerDuty, Opsgenie, SMS and voice are planned for log alerts. Those destinations currently support monitor-check routing only.
Incident creation and notification delivery are separate steps, so an incident can exist even when delivery fails. Follow the alert-testing guide to repair the channel configuration and retrigger. Test alerts report whether each channel succeeded or failed, with the exact error on failure. Consult the operations runbook for operational guidance.
Test empty results, not only threshold breaches
Loki illustrates why empty results need testing. It supports log-derived metrics and Prometheus-style alert rules. When nothing matches, LogQL metric queries normally return no points rather than a numeric zero. As a result, count_over_time rules can oscillate or remain unresolved during quiet periods.
Test the empty-result path explicitly. Loki documents or on() vector(0) for zero fallback and recommends checking that denominators exceed zero in ratio queries. Before enabling pages, verify that any fallback preserves the distinction between healthy silence and missing telemetry.
How should log retention, archives and audit trails support your policies?
Define retention as a set of separate requirements. Searchable retention determines which events analysts can query directly. Cold archives keep older data outside that window, while replay returns stored events to a processing or analysis workflow. Deletion removes data on an approved schedule. Administrative audit records show who changed access, settings or other controls. Application logs cannot substitute for those records.
Turn organizational compliance policies into requirements operators can test. Specify who can read or export each category, when its retention period begins, which investigation records must be preserved, and how operators will verify deletion. Policy owners should approve the durations and exceptions. Product controls alone cannot establish legal sufficiency.
Write the requirements before choosing storage
Document the requirements in a table like this. Replace each decision with an approved value instead of relying on installation defaults.
| Data category | Owner | Searchable period | Archive period | Authorized users | Retrieval test | Deletion evidence |
|---|---|---|---|---|---|---|
| Authentication and security events | Security owner | Decide investigation window | Decide policy requirement | Approved SOC roles | Recover a known event | Expiry result and sampled verification |
| Application and infrastructure logs | Service owner | Decide troubleshooting window | Decide business need | Assigned NOC/SRE roles | Retrieve an older incident sample | Removal record across storage tiers |
| Investigation records | Incident owner | Decide case-access period | Decide evidence requirement | Assigned investigators | Reconstruct evidence and disposition | Approved disposal record |
| Administrative activity | Platform owner | Decide review window | Decide accountability requirement | Authorized reviewers | Trace a known access change | Expiry evidence and exception register |
Keep the query, relevant event references, analyst decision and approved exports with each investigation record. Set access and deletion rules for those exports separately.
Verify 24Observe’s deployed behavior
We cover 24Observe first because its organization isolation and audit export directly address these requirements. It is built by the Networkers Home group, so weigh our view accordingly. Self-hosting is available.
The audit records use hash links. Role-based controls are described in the administration documentation, and read-only agent tokens restrict access for automated investigations. Queries apply organization-level filtering. Cold archives keep each organization’s logs, check results, audit records and webhook deliveries separate.
For external reviews, downstream collectors can use cursor-based audit export. Through the audit API, reviewers can filter by action, user, token or time and export CSV output. The trigger and observations are captured in incident records, along with the user’s conclusion.
Verify retention against the deployed version. The administration guidance describes configurable rolling windows for different data types. However, the v1 logs documentation gives a server default of 30 days and lists plan-dependent retention as planned. Configurable windows should not be assumed identical across deployments or versions.
Deleting an organization removes its data across stores using a ledger that retries failed operations. Check the evidence that deletion completed; acceptance of the request does not prove completion.
Compare archive and deletion mechanics fairly
- Graylog: The self-managed Open edition suits teams running their own stack. It supports archives on EU-based OVH or Secunet S3-compatible storage. Enterprise adds a data lake and parallel restoration, plus support for Azure Blob. Check the edition before setting archive requirements.
- Grafana Loki: Teams building a logging stack can deploy it themselves or use Grafana Cloud. Retention requires an active Compactor with
retention_enabledset in its configuration. Deletion is delayed by scheduled processing and a configurable grace period, so disk usage may not drop immediately. - Sumo Logic: This SaaS option suits teams that prefer hosted operations. Its retention policies determine storage duration. Check those settings against every approved data category.
- Cribl Stream: Teams separating pipelines from analytics can choose on-premises, managed-cloud or hybrid deployment. It retains full-fidelity data in inexpensive storage and can replay from Cribl Lake, S3 and other data lakes. Verify that retrieval works in the intended investigation workflow.
What drives log management software costs?
Log management software costs depend on when data becomes billable, how long it stays searchable, and who runs the system. Before comparing quotes, build a monthly worksheet using measured traffic and investigation workloads. The headline rate rarely captures the full cost of operation.
Build a worksheet around the data lifecycle
| Cost line | What to record |
|---|---|
| Collected volume | Raw bytes captured by collectors before filtering, including traffic spikes. |
| Accepted volume | Bytes successfully admitted through log ingestion; reconcile rejected events and retries. |
| Indexed events | Searchable event count and average event size, separately from bytes. |
| Scanning | Bytes examined per query, query frequency, and typical search windows. |
| Retention | Searchable days by source and applicable retention settings. |
| Archives | Stored bytes, storage duration, and storage-request charges. |
| Retrieval | Restore frequency, retrieved bytes, transfer, and reprocessing charges. |
| Infrastructure | Compute, storage, network transfer, redundancy, and backup capacity. |
| Maintenance | Loaded engineering rate multiplied by upgrade, tuning, backup, and recovery hours. |
| Analyst effort | Loaded analyst rate multiplied by investigation hours; track alongside MTTR. |
Match each quoted rate to the unit it bills against, and record any included allowances. Keep subscription charges separate from internal labour.
Ingested GB, scanned GB, and indexed events measure different things. A dataset may enter the system once and be searched many times. Its event count also depends on message size. Compare the total cost of running the same workload rather than reducing every rate to interchangeable dollars per GB.
Read each product’s charging model separately
24Observe is built by our group, so weigh our view accordingly. We list it first to examine how its combined logging and SIEM offering is priced. Its logging is described as flat-rate, but check the allowances carefully: 24Observe pricing lists Free, Team, Business, and Scale, while API query budgets use Free, Startup, and Pro. The hosted-plan restriction excludes application-log ingestion. These details cannot be treated as a single pricing table. Before budgeting, confirm the edition and its allowances, query limits, and self-hosting terms.
- Elastic starts at a stated $0.07 per GB ingested and suits teams analysing structured and unstructured logs. Check which edition, deployment model, and services that rate covers before calculating the monthly total.
- Splunk offers self-hosted Enterprise and SaaS Cloud for teams that need SPL-based analytics. Licensing includes units based on daily indexed volume, so daily ingest affects cost. Security or observability modules carry additional charges; request a quote for the edition you intend to use.
- Graylog Open is a self-managed option for teams that want guided search. Under SSPL, it has no licence charge, ingestion caps, or per-user charges. Include installation and configuration in the budget, along with ongoing maintenance and backups. Hosting it for third parties brings additional SSPL obligations.
- Grafana Loki suits logging workflows centred on Grafana and is available through self-hosting or Grafana Cloud. With self-hosting, your team is responsible for component availability, scaling, and maintenance. Account for that work as well as storage and compute.
- Datadog suits teams connecting logs to broader telemetry through SaaS. Its documented billing dimensions cover ingested GB, millions of indexed events, retention tiers, and Flex storage. Calculate each dimension separately.
Cribl Stream is a pipeline architecture choice. Filtering, sampling, and log-to-metric aggregation can alter downstream volume; retaining full-fidelity data supports replay. It offers on-premises, managed-cloud, or hybrid deployment. Before estimating savings, account for running the pipeline, storing archives, and processing replayed data.
Which log management tool should you shortlist? 10 options compared
24Observe
24Observe is built by the Networkers Home group, so weigh our view accordingly. We list it first because shared operational and security incident context fits this guide’s NOC, SOC and SRE audience. The order reflects our editorial judgement, not an independent ranking.
Its clearest use case is investigating operational faults and security events together. Monitoring, observability and SIEM share a datastore and incident records. The context graph links entities, including hosts, users and IP addresses, across investigations. Teams can use those connections as a starting point when examining related activity.
Hosted plans do not accept application logs. Verify application-log support for any other deployment before designing a pilot. Check the self-hosting information for deployment details. Self-hosting alone does not establish support for the log sources you intend to use.
During ingestion, security enrichment adds GeoIP information, reputation data for IP addresses, matches against indicators and ECS fields. Analysts can then use log search for text matching, structured KQL-lite filters, facets, live tail and pattern grouping. These support investigations that move from a suspicious address to an affected service and its surrounding messages.
For error investigation, the platform fingerprints stack traces and groups recurring failures. Each group shows an occurrence count, first and most recent timestamps, and a sample message. Incident records retain the event that triggered them, recorded observations and the analyst’s conclusions. Detection matches follow the same incident workflow as operational alerts.
The trade-off is analytical freedom. Elastic gives users more direct control over the search engine, while specialist-built Splunk analytics can go beyond 24Observe’s scope. Check dependencies on customized SPL searches or specific Splunk apps individually; query portability needs verification.
Elastic
Consider Elastic when indexed analysis, explicit schemas and flexible query composition take priority over a prescribed incident workflow. Its logging capabilities use Elasticsearch to handle both structured events and unstructured messages.
It suits platform or security engineering teams that want control over how they represent and analyze logs. Elastic can interpret schemas at read time or apply them at write time. With ES|QL, teams can build pipelines to filter, transform, join, correlate and aggregate data. That scope matters when an investigation depends on relationships across datasets.
For high-volume logging, Elasticsearch provides logsdb indexing, including sorting and tighter compression. Elastic also correlates logs with metrics and traces, with integrations covering databases, cloud services and Kubernetes.
The supplied evidence does not establish Elastic’s deployment choices. Confirm the available model and the operational work it assigns to your team before choosing an architecture.
Test field mappings and investigation queries together. Representative events will help you compare schema approaches and identify which configuration responsibilities your team will retain under the proposed deployment.
Splunk
Splunk belongs on the shortlist when investigations depend on SPL analytics and its established app ecosystem. Its search capabilities help analysts troubleshoot and extract information from events. Splunkbase supplies apps and integrations, while Enterprise Security provides security monitoring.
The deployment choices are established: teams can operate Splunk Enterprise themselves or use Splunk Cloud as a SaaS service. Organizations can therefore retain SPL-based workflows while choosing between infrastructure ownership and a hosted service.
It suits teams with analysts who can build and maintain searches, supported by engineers responsible for the chosen deployment. SPL provides considerable analytical scope, with a substantial learning burden identified in the supplied evidence. Operating Enterprise yourself also demands significant computing resources and ongoing operational work.
When evaluating cost, account for the volume indexed each day and any added security or observability modules. Keep the logging platform and specialist capabilities separate in the purchasing assessment.
Our Splunk comparison recognizes that some bespoke analytics go beyond 24Observe’s capabilities. Identify the SPL searches and apps your team cannot do without, then test alternatives against those dependencies. Similar feature lists will not establish whether those investigations can be reproduced.
Graylog
Graylog Open suits teams that want to run their own centralized logging service. It accepts syslog, Windows event data, Kubernetes and cloud-service sources. Investigation and administration features include guided Boolean search, processing pipelines and Sidecar agent management. Dashboards and threshold-triggered notifications support operational monitoring.
You can deploy it on-premises, on cloud infrastructure or across a mixed environment. Each arrangement is self-managed, leaving your team responsible for installation, configuration, maintenance and backups.
Graylog Open is available to download and use without per-user charges, ingestion caps or a trial expiry. Infrastructure teams willing to operate the service should still budget for infrastructure and staffing. Support is community-based, so establish who will troubleshoot problems and maintain the installation.
Check the edition boundaries carefully. Enterprise adds a data lake, simultaneous archive restoration and support around the clock. Security adds risk scoring, automated investigation creation, behavioral analysis and prepared detection content.
Open uses the SSPL. Offering it to others as a hosted service creates additional licensing obligations. Review the intended service arrangement before committing, particularly if you are planning an MSP deployment.
Grafana Loki
Grafana Loki fits teams that want label-oriented logging in Grafana. It indexes metadata from labels and stores log messages in compressed chunks, leaving message contents unindexed. Source selection and disciplined label design therefore shape the investigation experience.
Loki can be self-hosted or used through Grafana Cloud. A local installation can run as a single executable and store data on the filesystem. Other supported storage destinations include Amazon S3 and Google Cloud Storage. Grafana Alloy can forward logs; Loki also accepts OTLP traffic and requests via its HTTP API.
Connect Loki to Grafana to investigate with Explore and LogQL. Logs Drilldown provides visual filtering, pattern discovery and error investigation without requiring analysts to write a query. This suits platform engineers who want logging workflows alongside their existing Grafana use.
Cardinality is the main trade-off. Every unique combination of labels produces a separate stream. Choose frequently queried dimensions with relatively few possible values, such as application or environment. Values with high cardinality multiply streams and can degrade ingestion and query performance.
Self-hosted operators also own component availability, capacity planning and maintenance. Test whether the proposed labels stay manageable under incident traffic, and assign responsibility for maintaining the stack as demand grows.
Datadog Logs
Datadog suits teams that want to investigate logs alongside its wider telemetry products. The SaaS platform connects logging to metrics, traces, APM and security monitoring. That makes it relevant to engineers who already work across those signals.
Datadog is SaaS-only; the supplied evidence identifies no self-hosted option. Teams that require a logging backend under their own operation should treat this as a selection boundary.
Collection includes agent-based forwarding, tagging and support for multiline messages. Datadog documents predefined parsing for more than 200 sources. Other capabilities include Live Tail streaming, OpenTelemetry-based correlation between logs and traces, and error tracking driven by logs. SRE and application operations teams handling varied infrastructure sources should test these against their own data.
Billing has several dimensions. Log-management charges depend on ingestion volume, the number of indexed events and retention. Retention tiers and Flex storage introduce further choices to review.
Decide which events need to stay indexed for routine investigations and which require a different retention treatment. Evaluate the wider telemetry workflow while keeping logging consumption assumptions explicit during procurement.
New Relic Logs
New Relic merits consideration for application and host investigations that need surrounding context. Logs appear beside other telemetry and infrastructure information. Teams can also build charts, dashboards and alerts from log data.
There are several documented forwarding routes. APM agents attach metadata and ordinarily forward application logs automatically. The infrastructure agent collects logs present on a machine, including application output, and supports custom attributes unavailable through APM agents. Teams can also use third-party integrations, the Log API, TCP or an OpenTelemetry Collector forwarding through OTLP.
This fits application operations and SRE teams investigating service failures with relevant host information close at hand. The supplied facts leave the deployment model unestablished, however. Confirm it separately; forwarding options do not establish how the backend is deployed.
Review access controls as part of the evaluation. Permissions differ by user type, and additional controls can restrict particular log data and manage group access to partitions.
Test which forwarding route retains the attributes you need. Check partition permissions against the boundaries between operational teams before settling on the design.
Sumo Logic
Sumo Logic is a SaaS option for teams combining analytics, retention controls and security monitoring. The supplied evidence establishes real-time analysis, configurable retention policies and SIEM capabilities for threat detection.
It best suits operations or security teams comfortable with SaaS that need explicit control over how long data stays stored.
Data residency needs separate verification. Strict location requirements may rule out a SaaS arrangement, but the evidence does not identify the specific arrangements available.
Confirm where your data would be stored and whether the proposed retention settings meet organizational requirements before shortlisting. The SaaS deployment model alone does not establish whether those requirements can be met.
Better Stack
Better Stack remains unassessed because the supplied material provides no supporting product facts. There is insufficient evidence here to identify its strongest use case, deployment model or suitable team. Before publication, check current documentation for logging capabilities, hosting arrangements and investigation limitations, then decide whether to include it on the shortlist.
Cribl Stream
Consider Cribl Stream when you need to prepare and route telemetry to downstream tools. Its pipeline collects events, removes unnecessary content, adds context and sends data in the format required by each destination.
Evaluate it as a processing and routing layer. That role differs from a standalone, searchable logging backend, so confirm which system analysts will use to search retained logs.
Deployment options include installation on your premises, a managed service through Cribl.Cloud and hybrid arrangements. Stream suits platform and security engineering teams that manage multiple analytics destinations or need to standardize data before delivery.
It can remove unwanted events or fields, enrich logs with external data and map telemetry to schemas including OCSF, ECS and UDM. Supported output destinations include Splunk, Elastic, Datadog and New Relic. It can also retain a complete, unabridged copy in storage or a data lake for replay later.
The trade-off is another processing tier to manage. Filtering and transformation choices determine what downstream investigators receive. Establish which events must remain unchanged and which transformations require review. Confirm where searches will run, and verify the searchable backend and replay destination separately from the pipeline deployment.
How do these log management tools compare side by side?
We list 24Observe first for NOC and SOC teams that want to investigate logs within a shared incident workflow. It is built by our group, so weigh our view accordingly. Use this table to narrow your shortlist: it compares documented fit and operating requirements. It does not benchmark or rank performance.
| Tool | Strongest documented fit | Deployment evidence | Search or processing model | Cost basis or operating burden | Qualification to verify |
|---|---|---|---|---|---|
| 24Observe | Combined NOC monitoring and SOC investigation | Hosted; self-hosted option | Regex, streaming tail, pattern grouping | Flat-rate plans | Hosted plans exclude application-log ingestion; confirm source eligibility |
| Splunk | Enterprise log analytics and security investigations | Enterprise self-hosting; Cloud SaaS | SPL-based analytics | Indexed GB/day licensing; additional module costs | Confirm SPL skills, required apps and licensing scope |
| Elastic | Analytics across structured and unstructured logs | Unestablished in supplied evidence | ES|QL; schema applied when reading or writing | Starts at $0.07 per ingested GB | Confirm deployment; Streams is private preview |
| Graylog | Centralized logging for teams managing their own infrastructure | Open is self-managed; on-premises, cloud or hybrid | Guided Boolean search; processing pipelines | Open has no licence charge under SSPL; maintenance remains yours | Enterprise adds data lake; Security adds SIEM functions |
| Grafana Loki | Teams using Grafana for log exploration | Local/self-hosted; Grafana Cloud | Indexes label metadata; log content remains unindexed; LogQL | Self-hosters manage availability, scaling and maintenance | Validate label cardinality and retention configuration |
| Datadog | Logs correlated with broader observability and security signals | SaaS-only; no self-hosted option | Source parsing; Live Tail | Ingested GB, indexed-event volume and retention | Model ingestion and indexing separately |
| Sumo Logic | SaaS operational analytics and security monitoring | SaaS | Real-time analytics; configurable retention | Cost basis unestablished in supplied evidence | Review residency requirements against proposed data location |
| New Relic | Application and host troubleshooting with related telemetry | Unestablished in supplied evidence | Text/attribute filtering; contextual log exploration | Log-reporting estimator available | Confirm deployment, forwarding configuration and access permissions |
| Cribl Stream | Processing telemetry before downstream analysis | On-premises, managed Cribl.Cloud or hybrid | Filters, enriches, transforms and routes telemetry | Pricing unestablished; downstream tools remain relevant | Processes telemetry upstream of an analytics destination; assess downstream search |
| Better Stack | Unassessed | Supporting facts not supplied | Unassessed | Unassessed | Obtain supporting documentation before comparison |
“Unestablished” marks a gap in the evidence; the capability remains unverified. The cost cells use different units, so they cannot identify the cheapest option. For 24Observe, review the documented search-control trade-offs and query limits alongside the hosted application-log exclusion before assuming its logging scope matches another platform’s.
What should your log management selection checklist include?
Classify every requirement as must-have, preferred or unnecessary. Avoid arbitrary weights: excellent dashboards cannot compensate for an ineligible deployment. Record the evidence, tested edition and acceptance owner beside each requirement.
| Decision area | What must you verify? |
|---|---|
| Deployment eligibility | Permitted hosting model, data location and operational responsibilities. |
| Source coverage | Required devices, applications, formats and transport paths work end to end. |
| Event integrity | Timestamps, multiline boundaries and original messages survive; losses and duplicates are detectable. |
| Field extraction | Required identifiers extract correctly, including after source-format changes. |
| Search tasks | Analysts can complete representative investigations using their own events. |
| Live access | Tail filters, reconnect behavior and visibility during collection delays meet operational needs. |
| Permissions | Collection credentials cannot read data unnecessarily; sensitive records remain restricted. |
| Alert behavior | Test matching, quiet periods, recovery, delivery failures and every required destination. |
| Retention | Confirm searchable duration, deletion behavior and configuration ownership. |
| Archive retrieval | Restore historical events and measure retrieval effort, elapsed time and charges. |
| Cost measurement | Measure ingest, indexing, storage, queries, retrieval, infrastructure and operator effort where applicable. |
Separate team priorities from purchase gates
NOC teams should prioritize device coverage, collection health and actionable routing. For SOC analysts, the priorities are event fidelity, normalized identity fields, restricted access and historical evidence. SREs need service-level searches, multiline errors, live investigation and predictable volume costs.
Stop the purchase if a must-have remains unverified, sensitive data is exposed, events disappear without explanation, or required alerts fail delivery. Check features against the specific edition, then review the license for hosting rights, usage restrictions and support entitlement. Name the collection-pipeline owner responsible for upgrades, parsing changes, buffering and failure recovery.
Resolve 24Observe’s version-specific questions first
We put 24Observe first here because its deployment restrictions and documentation differences need early scrutiny. It is built by our group, so weigh our view accordingly.
Before evaluation, check the following:
- Confirm the deployment restriction: hosted plans exclude application-log ingestion.
- Check the required alert channels. Listed log-alert destinations include email, webhooks, Slack, Discord, Teams and Telegram. The channel restrictions identify PagerDuty, Opsgenie, SMS and voice as monitor-check destinations, with log-alert support planned.
- Verify the deployed receiver. The v1 API documentation requires JSON and a collector for HTTP/protobuf; the collector documentation describes direct binary-protobuf acceptance.
- Confirm which retention version applies. Logs v1 specifies a 30-day server default and planned plan-specific retention.
- Test
logs:writeseparately fromlogs:readand check administrative controls. Reconcile measured usage with plan allowances.
Analysts need practice beyond a demonstration. Our optional Cybersecurity course includes a 49-scenario lab block using 24Observe: learners normalize device logs, perform detection and AI-assisted triage, then submit an incident disposition. The AI SOC Analyst course is another learning option to review.
How do you test centralized logging before moving production sources?
Run a parallel evaluation before switching production forwarding. Define acceptance criteria around your incident workflows: required fields, tolerable search delays, notification behaviour and archive-retrieval deadlines. Set those thresholds with the engineers who handle incidents.
24Observe is built by the Networkers Home group, so weigh our view accordingly. It supports incremental evaluation using telemetry copies while the existing stack stays operational. However, hosted plans exclude application-log ingestion. Confirm a suitable deployment before testing application logs.
- Choose representative sources, including authentication, firewall, host and cloud events, plus application errors where permitted. Prioritise sources behind critical detections.
- Preserve unmodified events with their timestamps and source identifiers. Send a bounded copy to the candidate without interrupting existing delivery.
- Reconcile ingestion by accounting for sent, accepted, rejected and searchable events. Include malformed records, duplicate deliveries and multiline errors. For 24Observe, verify ingestion rejection behaviour rather than assuming every request succeeded.
- Recreate recent incident searches against identical time ranges. Check that fields and multiline boundaries survive ingestion, and that search and live tail expose the evidence responders need.
- Exercise alerts and recovery by triggering, clearing and retriggering conditions. Include quiet alert windows, interrupted forwarding and failed notification channels. Check channel-level test results: an incident can open in 24Observe despite notification failure. Fix delivery and retrigger.
- Retrieve archived evidence by restoring a known sample. Search it, compare its contents with the original, and record retrieval time and operator effort.
- Test administrative changes to permissions, routing and retention settings. Verify that audit records identify who made each change, what they changed and when.
Use the telemetry test guide for synthetic detection and triage exercises. Before retiring Splunk, explicitly test custom SPL searches and app dependencies.
Document the evaluation decision with evidence for each acceptance criterion, unresolved limitations, named owners and expected operating cost. State whether to proceed, extend the evaluation or stop. Assign rollback responsibility before approving source migration.
Frequently asked questions about log management tools
These answers distinguish operational guidance from product-specific facts. For background on log pipelines and searching, see the log management guide.
Which log management tool should a combined NOC and SOC team consider?
24Observe is built by the Networkers Home group, so weigh our recommendation accordingly. Consider it first if your team needs shared operational and security investigations: its monitoring, observability and SIEM functions use a common datastore and incident records. The hosted offering excludes application-log ingestion. If application logs are essential, evaluate the self-hosted option against your sources, deployment requirements and capacity to operate it before committing.
What is the difference between log management and a SIEM?
Log management collects, organizes, searches and retains events for troubleshooting and investigation. A SIEM adds security-focused detection and correlation to help analysts identify suspicious activity. Centralizing firewall logs does not automatically create a detection programme. That requires useful rules, source coverage, investigation procedures and accountable responders. Although these workflows can share event data, teams still need to define their investigation goals and response responsibilities.
How long should you retain logs?
Base retention on your investigation needs, contractual obligations, applicable legal requirements and data sensitivity. Decide separately how long events must remain searchable and whether you need archives. Test deletion and retrieval; configuration alone does not prove either works. For a product-specific reference, 24Observe’s log documentation states a 30-day default for its v1 server and lists plan-specific retention as planned.
How much does log management software cost?
There is no universal monthly estimate. Model your actual ingestion, indexing, retention, query activity, support and infrastructure requirements. Datadog’s SaaS log offering, for example, charges for ingested gigabytes and indexed events, with retention also affecting expenditure. It suits teams seeking logs alongside other observability signals. Compare equivalent workloads and retention requirements, since a headline ingestion rate cannot establish the complete operating cost.
Is a free, self-managed log tool practical?
Yes, provided someone owns its operation. Graylog Open is available without licence charges under the SSPL and suits teams that want to manage centralized logging themselves. Your team remains responsible for installation, configuration, ongoing maintenance and backups. Account for infrastructure and engineering time in your evaluation, including recovery testing. Review the licence conditions before offering it to other organizations as a hosted service.
Does every log field need to be indexed?
No. Your indexing strategy depends on the searches you run and the storage engine. Grafana Loki indexes labels instead of message contents. Its self-hosted stack suits teams prepared to operate the components and design useful labels. Choose low-cardinality dimensions such as environment or application, and keep request identifiers out of labels. Structured metadata and query-time parsing provide alternatives without creating additional streams for every value.
Can log alerts page the on-call engineer?
Check support for log alerts specifically. 24Observe supports volume thresholds and ratio-based anomaly alerts; its anomaly comparison does not use machine learning. Log-alert notifications support email, webhooks, Slack, Discord, Microsoft Teams and Telegram. PagerDuty, Opsgenie, SMS and voice currently serve monitor-check alerts, with log-alert support planned. Before relying on any alert to page the on-call engineer, test delivery and recovery handling, and confirm who owns the response.
Frequently asked questions
What is the difference between log management and log analysis?
Log management covers the lifecycle of event data: collecting it, parsing fields, controlling access, searching, alerting, retaining and eventually deleting or archiving it. Log analysis is the investigation performed on that data, such as finding repeated errors or following authentication activity. Evaluate both separately. A collection pipeline can be reliable while its search workflow is unsuitable, and an effective search interface cannot recover events that were never collected.
Which log management tool should NOC and SOC teams evaluate together?
Start with shared requirements: device events, identity context, investigation access and incident ownership. We discuss 24Observe first because it connects operational and security evidence through shared incidents and ingest enrichment. It is built by our group, so weigh our view accordingly. Its hosted plans do not ingest application logs. A shortlist should therefore consider deployment eligibility before comparing search features, and include alternatives suited to the team's existing skills and architecture.
Should I use JSON, syslog or OpenTelemetry for centralized logging?
These options address different parts of the pipeline. JSON structures an event's fields, syslog carries system or device messages, and OpenTelemetry provides a telemetry data model and export protocols. Start with what your sources produce reliably, then test parsing and delivery. Loki accepts OTLP, and New Relic documents an OpenTelemetry forwarding path. For 24Observe, verify the receiver version and encoding because the supplied facts describe different OTLP transport requirements.
How long should logs remain searchable or archived?
Choose retention from investigation needs, internal policy, contractual obligations and applicable legal requirements, rather than a universal duration. Searchable storage and archives can have different periods and retrieval expectations. Sumo Logic provides retention policies, while Loki uses its Compactor for retention processing. For 24Observe, confirm deployment-specific behavior: the supplied facts describe configurable windows alongside a version-specific 30-day server default. Test deletion and archive retrieval instead of assuming either is immediate.
Does Grafana Loki index every field in a log?
Loki indexes stream labels rather than the full event content. Its queries can parse fields from log lines, and structured metadata can attach additional attributes without creating separate streams. Label design therefore matters. Frequently used dimensions with few distinct values are better candidates than identifiers that change constantly. High-cardinality labels create additional streams and can harm ingestion and query performance. This differs from treating every event attribute as an indexed search field.
Why is price per GB insufficient when comparing log management software?
A GB may represent collected, ingested, scanned or retained data, depending on the billing model. Other charges can depend on indexed event counts, retention tiers or additional modules. Datadog documents ingestion and indexed-event dimensions, while self-managed products also require infrastructure and operational work. Compare the same representative workload across candidates, including archive retrieval and maintenance. Do not treat different entry-level billing units as equivalent total costs.
Can log monitoring alerts detect anomalies without machine learning?
Yes. A rule can compare recent event volume with a historical reference and alert when their ratio exceeds a threshold. 24Observe documents this approach using a seven-day baseline and a threefold increase; it is not a machine-learning detector. Notification support also needs verification. Its log alerts support email, webhooks and several chat channels, while PagerDuty, Opsgenie, SMS and voice are described as planned for log-alert routing.