Server Monitoring Tools · 24Observe
Server monitoring tools for 2026: 10 options for Linux, websites and APIs
Swipe sideways to see the whole diagram.
What do server monitoring tools actually monitor?
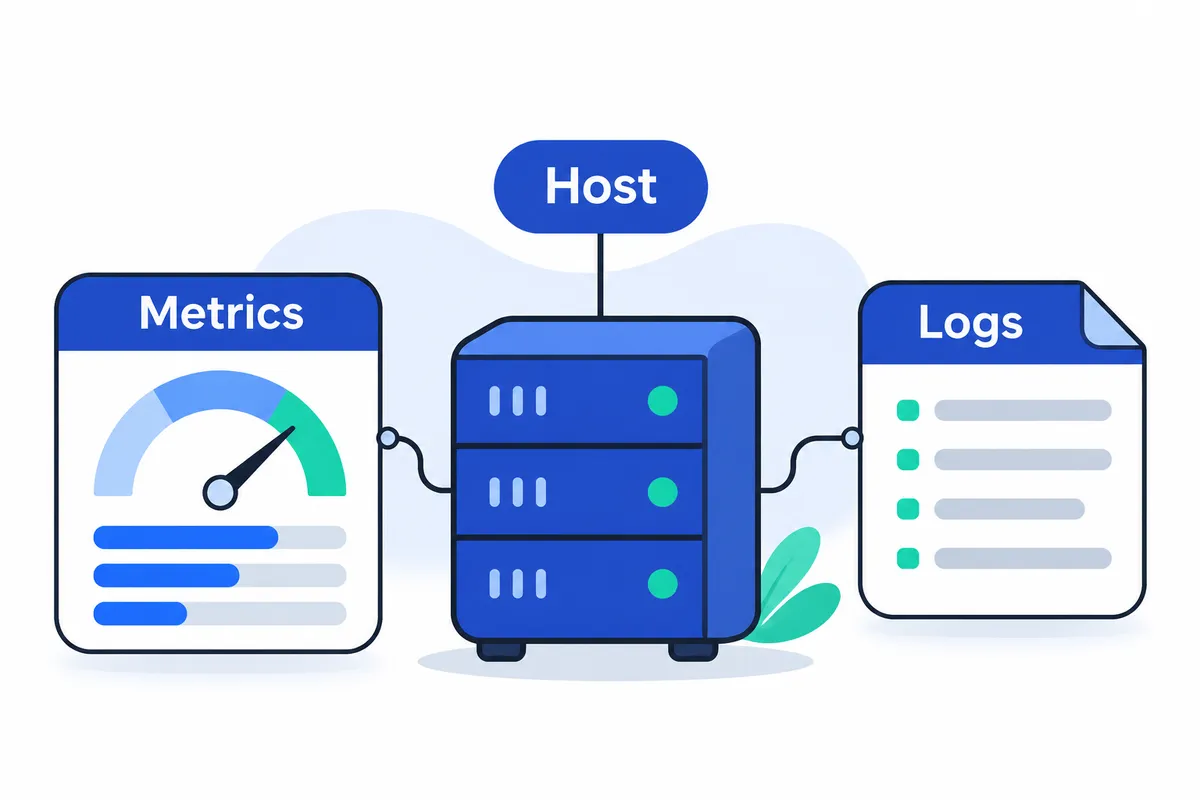
An application can fail while its host still answers ping. A dashboard can show normal CPU and memory even though last night’s backup never completed. These failures expose a common monitoring gap: a reachable machine tells you little about whether its services work or its scheduled jobs succeeded.
At Networkers Home, founded in 2007 by Vikas Swami, we write for engineers who need to distinguish a healthy host from a working service. 24Observe is built by our group, so weigh our view accordingly. Our starting point for tool selection is the evidence an engineer will need when something breaks.
Measurements show resource use, pressure and service state
The measurements a server monitoring tool collects depend on its collector, the operating system, its configuration and which checks are enabled.
CPU utilization measures how much processor time is busy. Load describes work running or waiting; on Linux, that includes tasks in uninterruptible sleep, often associated with I/O. Compare load with the available CPU count and examine waiting states before concluding that the processor needs more capacity.
Low free memory, on its own, provides little evidence of memory pressure. Linux puts otherwise idle RAM to work as cache, much of which can be reclaimed. Look at available memory alongside swap activity, allocation failures and out-of-memory events. Sustained swapping warrants investigation; allocated swap alone does not establish an active shortage.
Storage capacity and I/O performance answer different questions. Free bytes and available inodes tell you whether a filesystem can accept more data. Latency, throughput, queueing and IOPS describe how it handles requests. Slow writes can stall an application even when the disk has plenty of space. Account for that distinction when defining metric alerts.
For process health, check whether the expected service is running, whether it keeps restarting and whether its resource use is unusual. Process presence needs a separate functional check because a running process can still be stuck.
Network throughput tells you how much traffic is moving. To investigate communication problems, examine interface errors and drops alongside connection failures and packet loss. Interpret spikes in context: legitimate demand, replication, retries and unwanted activity can all increase traffic.
These measurements give you evidence to investigate, not a single definition of “healthy.” The difference between monitoring and observability matters when a threshold flags a symptom without explaining its cause.
Keep measurements, logs and external tests separate
Measurements describe values or states over time, including host CPU and filesystem readings. Check when the telemetry was last collected: a chart that looks normal but contains stale samples cannot establish current health. As a concrete collection example, the 24Observe Linux Sensor sends host metrics and system logs.
Logs capture events such as a service exit, a denied connection, a failed write or an application exception. When a metric changes, use log management to examine what happened around that time. An absence of log entries does not prove that an operation succeeded.
External tests show what a client can reach or use from a particular vantage point. Each availability check answers a specific question. Ping tests reachability; a TCP connection tests a listener. An application request tests service behavior. For scheduled work, collect explicit completion evidence through something such as job heartbeats. Host health alone cannot tell you whether a job finished.
Match each symptom to evidence
| Symptom | Evidence to collect | What it helps distinguish |
|---|---|---|
| Unreachable host | External probes, telemetry freshness, network-path checks | Host failure, path failure or collection failure |
| Overloaded processor | CPU utilization, load, CPU count, process activity | Compute saturation versus waiting work |
| Memory pressure | Available memory, swap activity, allocation or termination events | Reclaimable cache versus an active shortage |
| Exhausted storage | Filesystem bytes, inodes, write errors | Capacity exhaustion versus another write failure |
| Stopped process | Service state, restart history, exit logs | Intentional shutdown, crash or restart loop |
| Application error | Functional test results, application logs, resource measurements | Service failure despite a reachable host |
A product profile should explain its scope and deployment choices clearly. Tools in the same category can serve different operational needs, and a feature description gives you something to evaluate, not evidence of measured performance. With uptime checks, specify the service behavior you need to test and where the test should run. For host monitoring, confirm which measurements and logs you need to investigate failures. Before choosing a tool, verify each required signal and deployment assumption, keeping documented capabilities separate from results you have tested yourself.
What should website monitoring and API monitoring check?
Server metrics describe the machine. Outside-in checks test whether someone can reach the service and receive a useful result. A healthy host can still serve the wrong login page, return an unusable API payload or leave scheduled work unfinished.
Build website monitoring and API monitoring around explicit success conditions. 24Observe’s uptime monitoring covers several of these checks. It is built by our group, so weigh our view accordingly.
| Check | What success should mean |
|---|---|
| Reachability | The intended public endpoint accepts a connection and returns an acceptable HTTP status. |
| Response duration | The response arrives within a threshold appropriate to that operation. |
| Expected content | The page or API payload contains the information the application requires. |
| Certificate validity | The certificate remains valid, and its trust chain passes validation. |
| Browser-rendered output | The expected page content appears after JavaScript executes. |
| Scheduled completion | A job reports successful completion before its deadline. |
The scenarios below are hypothetical design examples, not product test results.
Check reachability and duration separately
Start with the address users or client applications actually call. Checking a server’s private address does not establish that its public route works. DNS, network access, TLS negotiation and the HTTP response can each affect availability.
Define acceptable response duration for each operation. An endpoint can respond successfully yet take longer than the consuming application will tolerate. Choose thresholds around the operation’s requirements rather than applying one arbitrary timeout everywhere. Keep availability failures distinct from slow responses so the responder knows what failed.
Location matters too. In 24Observe, the documented multi-region option currently applies to HTTP/HTTPS monitoring. Browser, certificate, heartbeat and other check families should be assessed separately; do not assume they share that regional execution model.
Verify the expected business response
An HTTP status describes how a request was handled at the protocol level. It does not establish that the application delivered the right business result.
Consider a hypothetical login failure: /login returns HTTP 200, but its body contains a maintenance notice instead of the sign-in form. A status-only check passes even though users cannot access the intended page. A content assertion should look for a stable element that identifies the correct page. Generic text shared across the site cannot distinguish it.
24Observe supports expected-content validation, including detecting the wrong page behind a successful status. Its uptime-check guide explains content checks alongside basic availability checks.
For a hypothetical API failure, suppose a payment endpoint should return a payment_state field, but a deployment replaces it with an unexpected status field. The server still returns valid JSON and HTTP 200. A client expecting the original field can fail.
24Observe can validate expected JSON content, including a particular response field. When designing API monitoring, specify the required field and expected value where appropriate. Valid JSON establishes syntax; business correctness requires checks against the expected response. Keep assertions focused on stable contract requirements so routine data changes do not create unnecessary failures.
Use SSL certificate monitoring, with TLS terminology understood
“SSL certificate monitoring” is the common search term. Modern HTTPS uses TLS; SSL names the older protocol family. Check certificate validity and trust separately from whether the HTTPS port responds.
24Observe checks the complete certificate chain and issues an expiry warning with seven days remaining, as documented on its feature page. Use that warning to verify renewal and deployment, then confirm which certificate the endpoint actually presents. An automated renewal process still needs independent verification.
Inspect what the browser actually renders
A raw HTML response may contain little more than an application shell. JavaScript or a data request can fail, leaving the required content absent.
24Observe executes JavaScript through headless Chromium and checks the resulting DOM, including content produced after data fetching. The browser-monitor documentation describes this check family.
A browser check is a scheduled synthetic check: it exercises a controlled browser run at configured intervals. These checks do not provide real-user monitoring or describe every visitor’s device, connection or session.
Require scheduled jobs to prove completion
Cron job monitoring requires a success signal before a deadline.
In a hypothetical backup failure, the nightly backup never sends its completion signal. The host remains reachable, but there is no evidence that the backup finished.
24Observe supports cron heartbeats. Its documented job workflow sends an HTTP POST to a job-specific URL after a successful run. Send that signal after the work and its validation. A signal sent at process startup cannot establish completion.
Use the heartbeat documentation when wiring the completion signal. A heartbeat proves that the reporting point was reached; backup recoverability still requires separate restore testing.
Agent versus agentless monitoring: which should you use?
Use an agent when you need evidence from inside a server. Choose agentless collection when installation is impractical or exposed management interfaces answer your question. Agentless collection still requires configuration. What polling reveals depends on the interface, so verify its coverage against what a host agent can inspect.
| Decision point | Agent-based collection | Agentless collection |
|---|---|---|
| Installation requirements | Install and configure software on each monitored host. | Configure a remote poller and the target’s supported interfaces. |
| Visibility inside the host | Local access supports detailed metrics and logs, subject to permissions. | Visibility depends on what the protocol or endpoint exposes. |
| Network access | Required connections depend on push or pull configuration. | Pollers need access to target interfaces; traps require a receiving path. |
| Credentials | Manage local permissions and collection credentials or tokens. | Manage protocol credentials where required; reachability checks may need none. |
| Maintenance responsibility | Own agent updates, configuration and resource usage. | Own pollers, protocol settings, credential rotation and target mappings. |
| Connectivity problems | Buffering is implementation-specific; verify capacity and persistence. | Unreachable targets cannot answer polls. Missing observations are not healthy readings. |
Push and pull describe direction, not installation
Push means the reporting component sends data; pull means a collector requests it. Either pattern can involve installed software. For any deployment described as “agentless,” you still need to establish where connections originate and which firewall paths collection requires. Decide what should happen when delivery fails.
How these approaches appear in practice
We list 24Observe, built by our Networkers Home group, first because its collector illustrates the mixed approach. We disclose that connection so you can weigh our view accordingly. The collector gathers server logs and host metrics, while polling network devices without installing software on them. Deployment configuration is covered in the collector documentation. SNMP interface measurements and host disk measurements use the same threshold configuration approach, although their collection methods differ.
Zabbix suits teams needing several collection methods. It supports push and pull, with agentless options including SNMP polling and traps, IPMI, SSH/Telnet, ODBC, ICMP and TCP checks. Its agents can retain observations in memory or on disk during communication interruptions. Remote proxies can also buffer locally when their upstream connection fails. Buffering preserves collected observations; polls missed while a target was unreachable remain missing.
Site24x7 offers an installed agent for detailed server measurements, with SNMP/WMI alternatives where agent installation is impractical. It suits environments needing host-level collection alongside remote monitoring. Assess the detail available from each method separately.
Choose mixed coverage and assign ownership
Pair internal collection with external service checks. Disk pressure helps explain a server problem, while an external request tests whether the service remains reachable.
Apply least-privilege credentials to each collection path. Document traffic destinations, direction, frequency and expected volume. Assign owners for host collection configuration, pollers, credential rotation and updates. Test connectivity loss explicitly, including how operators distinguish stale telemetry from current measurements.
How do you set up Linux server monitoring with a one-command sensor?
The current compatibility boundary is Ubuntu or Debian using systemd. Confirm the distribution and init system before planning a rollout. 24Observe is built by our group, so weigh our view accordingly. Its Linux Sensor collects host logs and resource measurements through one installation. The Linux Sensor overview describes that scope. Start with a host where you can verify the operating environment and check the telemetry you expect to receive.
Open Settings → Linux Hosts in 24Observe and obtain the generated installation command. It includes a scoped enrollment credential. Review the command, confirm that your terminal session is connected to the intended server, and run it there as root. Use the command generated for that environment; avoid installation lines copied from unrelated tutorials or other environments. The quickstart instructions identify the installation location and required privileges. Refer to those instructions when preparing the installation instead of reconstructing the command from memory.
The Sensor installs through a signed package and enrolls itself. During enrollment, it exchanges the initial credential for a host-specific credential restricted to sending logs and metrics. In a security review, distinguish the bootstrap credential used for enrollment from the host credential used for ongoing telemetry. The log collection overview documents the signed-package installation, while the Sensor documentation explains the credential exchange. Check those roles when reviewing how the host enrolls and what its ongoing credential permits.
The base configuration forwards journald entries and host measurements using OTLP, the OpenTelemetry Protocol. A separate metrics agent is unnecessary for this Sensor’s host measurements. Its documented behavior also includes secret redaction at the edge, described in the platform concepts. Review the actual data being collected before expanding deployment. Redaction provides a collection safeguard; you still need to inspect operational logs for sensitive material and check what reaches the platform.
Expect processor, memory, storage and network series after installation. These host measurements can be charted and used in alert conditions, as outlined in the metrics overview. Verify that every resource category is arriving before setting thresholds. The metric alert documentation explains how those measurements connect to threshold configuration. For initial acceptance, check that the data is present and current. An installed package alone does not establish that monitoring is working.
Return to Settings → Linux Hosts → Enrolled hosts and confirm that the intended server appears. Then inspect Explore / Logs for its incoming entries. Compare recognizable host activity with what you see locally, checking that you have selected the correct server and time period. The log documentation provides broader collection guidance. Verify enrollment and log delivery separately: a host can appear in the list without establishing that the expected events are reaching the platform.
On the server, use the Sensor’s documented status command to check whether it is running. Use its logs command with the follow option to inspect what it is shipping. Get the exact syntax from the Sensor documentation, including the executable names and service identifiers, rather than guessing them. If installation appears complete but expected data is missing, work through local status and outgoing logs, then compare those findings with what is visible in the platform.
Add optional collection profiles when the workload requires them. The Docker profile captures container stdout and stderr, while the nginx profile gathers access and error logs. Neither should be assumed active in the base installation. The Sensor supports repeating the profile option to select additional sources. Choose the sources the host needs, enable the relevant profiles, and repeat the outgoing-data and received-entry checks for those sources.
Finally, verify host-level and process-level visibility separately. Host CPU or memory series do not demonstrate individual-process consumption. If acceptance depends on identifying a specific resource-heavy process, keep that requirement explicit. Verify a suitable collection method separately before approving the rollout, so host measurements alone are not used to sign off a process-level requirement.
How can monitoring alerts close themselves when service recovers?
Monitoring alerts can close automatically when fresh telemetry shows that the failure condition has cleared. Closing an incident after recovery does not prove that the monitoring product repaired the service. An engineer, an external automation or the service itself may have restored operation.
We start with 24Observe because it directly supports automatic resolution after recovery. It is built by our group, so weigh our view accordingly. A self-hosted deployment is also available.
Follow the incident from failure to resolution
- A failure occurs: a website check fails, a metric crosses its threshold, a scheduled job misses its heartbeat or a host stops reporting.
- 24Observe brings these conditions into its incident handling workflow to create an incident. Assign a service owner who can investigate and act.
- During investigation, its AI analyst gathers evidence using read-only tools. It examines logs and queries metrics. It also follows relationships through the context graph and reviews recent changes, testing possible explanations against telemetry. Treat its findings as evidence-backed hypotheses rather than guaranteed root-cause answers.
- A responder acknowledges the incident, accepting responsibility while investigation may continue. Through alerting, incident emails offer single-tap actions to acknowledge or resolve. PagerDuty and Opsgenie support escalation and paging handoff, with closure support for pages sent through them.
- Recovery is established when subsequent observations show that the original failure condition no longer holds.
- 24Observe automatically resolves the incident once that condition clears. Record what restored service separately from what detected recovery.
Keep three actions distinct: acknowledgment records responder engagement; silencing suppresses notifications; resolution closes the incident. Neither acknowledgment nor silence establishes that service is healthy. A manual resolution action also needs supporting evidence.
Define an incident record that responders can use
The following example is hypothetical and does not represent a product default:
| Field | Example |
|---|---|
| Trigger | Checkout API returns an unexpected HTTP status |
| Owner | Payments service on-call engineer |
| Evidence | Failed check results, upstream connection errors and host metrics from the same period |
| Acknowledgment | Responder accepts the investigation |
| Recovery condition | The endpoint again returns the expected status and response content |
| Resolution note | Recovery observed; the engineer’s repair action is documented separately |
Set actionable thresholds around service impact and a realistic response. Avoid paging someone for a brief resource spike unless there is a clear reason to act. Schedule maintenance windows for planned work: in 24Observe, checks keep running while alert notifications are paused.
Compare noise controls, then test recovery
Zabbix suits teams operating a server-and-proxy monitoring deployment that need dependency-aware alerting. Its dependency rules suppress downstream alerts, while flapping protection addresses repeated state changes. Escalations can repeat or defer notifications, route them to another user group and behave differently according to acknowledgment state.
Netdata suits teams using Agents connected to Netdata Cloud for infrastructure monitoring. Its ready-made alert rules can be adjusted, including warning and critical thresholds. Individual alerts can also be silenced through configuration, though silence does not establish recovery.
Before production use, deliberately trigger a safe failure, acknowledge it, restore service and verify resolution. Test external paging closure too, then repeat with a maintenance window active. Confirm that every alert reaches an accountable owner and that missing telemetry cannot be mistaken for a healthy service.
Which server monitoring tools fit your environment? A 10-tool comparison
Compare tools against the work your team must perform: collect host signals, check services externally, investigate failures and manage recovery. The table distinguishes documented use cases from questions the available evidence leaves open. Deployment entries identify documented components; they make no assumptions about SaaS delivery or licensing. “Unknown” marks a verification gap. Availability remains undetermined.
24Observe is built by the Networkers Home group, so weigh our view accordingly. We list it first because this comparison covers host telemetry, external checks and incident handling within a shared workflow. That order carries no independently established ranking, and we have assigned no scores.
| Tool | Strongest supported fit or evaluation focus | Documented deployment components | Evidence boundary |
|---|---|---|---|
| 24Observe | Teams bringing host signals, website checks and investigations into a common incident workflow | Linux Sensor; self-hosted services coordinated through containers | Current Sensor support covers Ubuntu/Debian hosts running systemd |
| Zabbix | Infrastructure teams requiring push/pull collection, agentless methods, dependency-based alert suppression and flapping controls | Central server, host agents and optional proxies for remote collection and buffering | Validate relevant templates and operational requirements against your environment |
| Nagios | Teams selecting an extensible engine for infrastructure checks | Nagios Core, optionally supplemented by NCPA and add-ons | Evaluate Core separately from commercial editions and additional components |
| Prometheus with Node Exporter | Engineers focused on host metrics and exploring them through expressions | Prometheus installation and a standalone Node Exporter binary | Node Exporter’s documented role here is host metrics; browser checks and log collection require separate verification |
| Netdata | Operators needing system metrics refreshed at one-second granularity | Agent linked to a Cloud Space; dashboards require Cloud authentication | Anomaly models execute locally without Cloud dependency; dashboard authentication is separate |
| Datadog | Candidate for an infrastructure-monitoring evaluation | Available migration guidance references an existing host agent | Evidence here does not establish detailed features, deployment alternatives or a strongest-fit recommendation |
| Site24x7 | Mixed-OS teams investigating host health and process resource consumption | Server agent, plus agentless collection using SNMP or WMI | Agentless support does not establish equivalent coverage to agent-based collection |
| Better Stack | Requested comparison candidate pending further verification | Unknown | Additional evidence is necessary before recommending a use case or asserting features |
| UptimeRobot | Requested comparison candidate pending further verification | Unknown | Additional evidence is necessary before recommending a use case or asserting features |
| Pingdom | Evaluating migration of existing uptime monitors | Migration instructions reference a source account and configured monitors | These references do not establish broader functionality or deployment architecture |
Apply five selection criteria before shortlisting
-
Start with the signals you need. Write down whether that includes host metrics, logs, process visibility, website responses or scheduled-job heartbeats. Prometheus with Node Exporter supports a metrics-focused evaluation. For broader requirements, verify each additional signal separately. A tool’s inclusion in this table establishes no further coverage.
-
Check operating-system requirements, including distribution, version, architecture and service manager. For 24Observe, account for the current Sensor support boundary. NCPA documents Windows, Linux and Mac support; Site24x7 documents collection on Windows and Linux. Test on the exact hosts you operate before approving deployment.
-
Decide whether you need internal collection, external checks or both. Host telemetry explains resource conditions; an external check tests reachability from its observation point. For uptime monitoring, specify the target, expected response and check location. With agentless collection, verify metric coverage and network access before assuming parity with an agent.
-
Test recovery behavior through failure, acknowledgment, recovery and recurrence as separate transitions. In 24Observe, incidents resolve automatically after their triggering condition clears. Check each candidate directly to establish how recovery works and whether repeated failures create duplicates or reopen an existing incident.
-
Assign operational ownership for agents, collection configuration, credentials, storage, upgrades and alert rules. Document what happens when collection stops, who is accountable for operating the tool and how its maintenance procedure has been tested.
Our comparison hub provides related evaluation material. It is our own product comparison content and provides no independent corroboration.
24Observe: host monitoring, website checks and incidents in one workflow
24Observe is built by the Networkers Home group, so weigh our view accordingly. We cover it first because it brings host health, website availability and incident investigation into one workflow. The founder story explains the aim of reducing the complexity of managing separate operational tools. It describes product intent and provides no independent evidence of performance.
Best fit: teams investigating availability and host health together
24Observe suits NOC engineers and SREs who need to investigate a failed website check alongside server telemetry. SOC analysts can use it to connect operational symptoms with authentication activity or other security events.
Monitoring, observability and SIEM share a data layer and incident records. A failed check can enter the same incident workflow as a breached metric threshold, a missing job heartbeat or an offline host. That matters when your current investigation process involves copying timestamps and host identifiers between tools.
Teams can start with uptime checks and logs, adding other capabilities as requirements develop.
Deployment: one Sensor installation and a self-hosted architecture
The Linux Sensor collects system logs and host metrics through a single installation. Metrics collection requires no additional agent. The Sensor enrolls automatically, removes secrets at the collection edge and sends journald events plus host measurements over OTLP by default.
Its host metrics cover CPU utilisation and memory use, along with disk measurements and network activity. Optional collection profiles add sources such as container output or nginx access and error logs. Installation requires root access. Review the command and enrollment scope before deploying it across production hosts.
For teams running the platform themselves, the self-host information describes container-orchestrated application services, a queue, relational storage and a columnar telemetry store. Records can share a data model while residing in different physical databases.
Self-hosting puts infrastructure responsibility with your team. Capacity planning and backup validation need ongoing attention, as do upgrades and storage monitoring. Include that work in the deployment plan.
Checks: seven basic labels, plus separate browser monitoring
The documentation lists seven basic check names:
| Basic check | Operational purpose |
|---|---|
| HTTP/S | Check availability of a website or API endpoint. |
| TCP | Verify that a target port accepts a connection. |
| SSL | Validate the certificate chain and warn before expiry. |
| Ping | Test network reachability. |
| Port | Check port availability, operationally overlapping with TCP checks. |
| Keyword | Verify that the response includes expected content. |
| Heartbeat | Receive a signal following a successful scheduled job. |
TCP and port overlap as labels for connection-level availability. The supplied documentation establishes no implementation distinction between them. Choose based on documented behaviour; there is no evidence here of a technical difference.
SSL/TLS monitoring checks the complete certificate chain and warns seven days before expiry. Keyword checks address a common blind spot: an HTTP response can report success while containing the wrong page or API content.
For scheduled work, send the heartbeat after the job completes successfully. Sending it at startup leaves completion unverified. A backup or synchronisation task that stops reporting can open an incident.
Browser checks sit outside this basic list. Browser monitors run headless Chromium to execute JavaScript and inspect the resulting DOM. They can verify content that appears after scripts load and data arrives. The seven basic names therefore cover only part of the platform’s monitoring capabilities; the fact sheet documents a broader catalog.
The opt-in multi-region feature currently applies only to HTTP/HTTPS. Use the API documentation to guide configuration. That regional execution option should not be assumed to cover browser, ping, TCP or heartbeat checks.
Investigation: connect the symptom to entities and recent changes
The context graph links machines with user identities and IP addresses across incidents. During an investigation, an operator can explore those entity relationships and examine relevant evidence around the failure window. This does not establish a direct link from a failed URL to its host.
The log product supplies event evidence alongside metrics. Ingested traces feed the graph as another signal, connecting with logs and measurements, deployment information and ownership context. Their role here is to support investigation. 24Observe should not be presented as an APM, distributed-tracing or RUM product.
The AI Analyst examines telemetry through read-only investigation tools. It follows relationships and retrieves recent changes, then proposes an evidence-supported cause and tests its hypotheses against relevant logs and metrics. Operators should inspect that evidence before accepting the explanation.
The incident workflow tracks recovery too: incidents resolve automatically when their triggering conditions clear. This records the return to a healthy condition without establishing that the underlying defect has been permanently fixed.
Limitations: verify compatibility, capacity and plan allowances
Documented Sensor support currently covers Ubuntu and Debian systems running systemd. This does not establish support for other Linux distributions, Windows or macOS. Check compatibility before committing to deployment across your fleet.
Storage grows with use. The operational runbook flags growth in check-result storage and recommends monitoring disk consumption in self-hosted installations. Base capacity estimates on your actual check frequency and telemetry volume. Consolidating tools does not guarantee lower operating costs.
Pricing checkpoint: Starter documents an allowance of 25 monitors; Team is listed at $29 monthly. Check the pricing page for interval restrictions and consumption allowances. Monitor count alone does not determine whether a plan fits your workload.
The supplied evidence includes no independently measured comparative performance results. Before choosing 24Observe for production, use representative workloads to test collection overhead and storage growth, and assess how useful its investigation tools are in practice.
When should you choose Zabbix, Nagios or Prometheus with Node Exporter?
We list 24Observe first because its host metrics, Linux Sensor and incident workflow address the combined monitoring workflow covered earlier. It is built by our group, so weigh our view accordingly. When evaluating the alternatives below, consider how they collect data, who maintains the checks and how much of the monitoring stack your team wants to assemble.
Zabbix: mixed collection methods and configurable event handling
Zabbix suits teams that need several collection methods and configurable responses when something fails. Its documented capabilities cover push and pull collection, dependencies, event correlation and remediation commands triggered by problems.
Its agents support Linux, Windows and macOS, among other operating systems. For assets where installing an agent is impractical, options include SNMP polling and traps, IPMI, SSH/Telnet, ODBC, ICMP and TCP checks. Operators can match the collection method to each asset without imposing the same approach everywhere.
A Zabbix server sits at the centre of the deployment, while proxies collect data at remote locations. Proxies can store collected data locally during a network interruption. Agents have separate buffering options, using memory or disk when communication fails. Test both mechanisms against the conditions you expect during a branch connectivity failure.
Pay equal attention to event handling. Dependencies can suppress notifications from downstream failures, and flapping protection handles states that change repeatedly. Correlation rules group related events and detect patterns over defined time windows, helping reduce alert noise. Remediation actions can run scripts or commands, including those that restart services. Before enabling them, establish permissions, decide how failures will be handled and define how recovery will be measured.
This fits NOC and infrastructure teams responsible for varied operating systems, network devices and remote sites. During evaluation, test a branch connection failure: does the proxy-and-dependency configuration retain collected data and keep downstream notifications from overwhelming operators?
Nagios: a monitoring engine with explicitly selected components
Evaluate Nagios Core separately from the other products in the family. Nagios Core provides the open-source monitoring engine. Commercial offerings add visualization, automation, reporting and governance capabilities. Keep those additions separate when documenting what Core includes.
The plugin model deserves close examination. Nagios Plugins provides packaged checks such as check_ping, check_ssh, check_cpu, check_memory and check_linux. These named checks give you something specific to validate. Define the condition you want to detect, then test the appropriate plugin on a representative host. Server reachability and application health require different acceptance criteria.
For host collection, NCPA stands for Nagios Cross-Platform Agent. It supports Windows, Linux and Mac, with coverage for system measurements, applications and networking. Account for it explicitly in the deployment alongside the monitoring engine. Agent arrangements can differ between Nagios installations.
Optional components affect daily operations too. Nagios Configuration Tools provides interfaces and discovery scripts for configuration tasks. Visualization Add-ons supply dashboards, maps and graphs. Document the component responsible for each requirement so that the proposed setup is clear. Test website availability separately, and record the steps an operator takes from a failed check to investigating logs.
Nagios suits administrators who want control over the monitoring engine and are prepared to select and maintain its checks and extensions. Can your team demonstrate every required check, name the component that provides it and maintain the configuration with a clear distinction between Core and commercial additions?
Prometheus with Node Exporter: an exporter-to-scraper metrics foundation
The deployment separates collection from scraping: Node Exporter exposes host measurements, and Prometheus retrieves them. According to the official guide, Node Exporter is a static executable supplied in a tarball. It is intended for Unix-like systems. Windows exporter serves the corresponding purpose for Windows hosts.
Hardware and kernel measurements are exposed through a /metrics endpoint. The guide shows this endpoint on port 9100, with Prometheus running as a separate process to scrape the measurements. It also walks through downloading and extracting Prometheus, then viewing the collected series in its expression browser.
These examples illustrate where interpretation matters:
node_filesystem_avail_bytesreports, in bytes, the filesystem space available to users who lack root privileges. Inspect the filesystem relevant to the problem; mounts are not interchangeable.node_cpu_seconds_totalrecords accumulated CPU time. Between resets, the counter increases, so reading the raw total does not tell you current CPU usage. A rate calculated over a recent window gives the change per second. The guide uses a one-minute window to examine CPU time spent in system mode.
The example uses a scrape interval of 15 seconds. This is an illustrative setting rather than a required default across deployments.
Plan for this pair as the metrics foundation within your wider monitoring and observability design. Logs, browser testing and incident coordination sit outside what Node Exporter provides.
This approach suits Linux-focused SRE and infrastructure teams willing to operate exporters, manage scraping and work with metric queries. In a pilot, can the team distinguish low filesystem capacity available to users from rising system-mode CPU activity? Document who owns the investigation and response workflow around those measurements.
How do Netdata, Datadog and Site24x7 compare?
24Observe, built by our group, comes first as our reference point because its Sensor collects host logs and metrics within the platform that handles incidents. Weigh our view accordingly. For the three tools below, separate documented capabilities from assumptions that need testing in a pilot.
Netdata
Evaluate Netdata when one-second metric granularity and views across multiple hosts matter. Its documentation describes automatic discovery of processor, memory, disk and network resources. Preconfigured alerts cover common problems. Administrators can adjust them to match operational thresholds.
Netdata installs an Agent on the monitored system. Its installation command identifies the operating system, installs the latest Agent and joins a Cloud Space. From version 2.0 onward, dashboard authentication goes through Netdata Cloud, so an installed Agent alone does not establish cloud-independent dashboard access.
Anomaly detection runs locally: machine-learning models execute on each Agent and learn normal behaviour without requiring Cloud. This local processing is separate from the dashboard’s Cloud authentication requirement.
For fleet troubleshooting, the Nodes Tab brings infrastructure metrics into a shared view, while Composite Charts aggregate measurements across nodes. These views suit engineers investigating whether a resource problem affects one machine or several.
Test thresholds against representative workloads during evaluation. Our metric-alert guide is separate from the evidence about Netdata behaviour. Assess alert fatigue in your pilot by checking whether alerts are actionable and thresholds match the conditions your team needs to investigate.
Datadog
The available evidence covers a specific migration scenario: an existing Datadog host agent can remain running while the 24Observe Sensor operates alongside it, as described in our migration documentation.
That establishes agent coexistence for this scenario. A detailed Datadog feature inventory, its full deployment architecture and a strongest-use-case recommendation all require separate validation.
Ask for a demonstration against your operating systems and required measurements. Check access restrictions and how the tool fits your incident workflow. During any proposed parallel-agent pilot, measure resource consumption to establish the operational cost of running both agents.
Site24x7
Evaluate Site24x7 for mixed-platform server estates that need process-level investigation and alternative collection methods. Its server-monitoring documentation covers Windows, Linux and macOS, alongside physical, virtual, cloud and hybrid environments.
Process visibility includes a Top Process chart for identifying heavy resource consumers, plus measurements covering process latency, threads, handles and disk I/O. Storage monitoring includes capacity, IOPS and latency. Network measurements cover throughput, interface errors, bandwidth consumption and packet loss.
Detailed server measurements come from an installed agent. Agentless SNMP and WMI options address devices or environments where installing software is impractical. Validate the measurements available through each method before relying on agentless access for agent-level detail. For network collection, check coverage against your actual devices, then confirm the required measurements are available within your access restrictions.
Site24x7 documents packaged plugins for MySQL, Apache and Nagios, plus custom plugins using languages including Python, Shell and PowerShell.
Automated remediation is documented through auto-heal actions and IT automation profiles. Validate which failures these actions can correct; documented remediation support does not guarantee recovery from every failure. Before enabling actions, define permissions and failure handling, including when to escalate to a person. Record those decisions in an operational playbook and review them before approving automated remediation.
What should you verify before choosing Better Stack, UptimeRobot or Pingdom?
We start with 24Observe’s documentation because it provides the migration evidence available for this comparison. 24Observe is built by our group, Networkers Home, so weigh our view accordingly.
Better Stack
The supplied evidence does not establish Better Stack’s capabilities, deployment model or best-fit teams. Request current documentation and test your requirements before adding it to your shortlist.
UptimeRobot
UptimeRobot’s functionality, deployment options and strongest use case remain unverified in the supplied material. Treat those gaps as limits of this assessment. They do not establish that a capability is absent.
Pingdom
The documented migration workflow calls for rebuilding checks with the same destinations and check intervals. Uptime history begins afresh, so retain the Pingdom account temporarily for access to older records. This workflow covers the transition; it leaves the broader Pingdom assessment open.
An import wizard covering these three tools remains planned and is unavailable today.
Shared verification checklist
Ask each vendor the same questions. The questions below are evaluation prompts; supported features still need verification. The evidence gaps above prevent a defensible feature-parity verdict, so record documentation links and observed test results before deciding.
- Check families: Which protocols, response assertions and scheduling intervals can you configure?
- Browser execution: Does a check run JavaScript and examine the rendered page, or just fetch an HTTP response?
- Certificate warnings: At what point are expiry warnings sent, and which certificate errors cause a check to fail?
- Heartbeat behavior: What indicates that a job succeeded? How does the service handle a missed run or a grace period?
- Notification recovery: When a service recovers, is the incident closed and are downstream notifications updated?
- Execution locations: From which locations do checks run, and which check families are available at each?
How do you set up server, website and cron job monitoring?
Roll out monitoring in dependency order. Define success first, collect evidence, then test failures before expanding coverage. This example uses 24Observe, built by our group, so weigh our view accordingly. Move through each stage when its acceptance criteria are met, without promising a completion time.
Define scope and service success
Start with an inventory of critical hosts, public websites and APIs, services presenting TLS certificates, and scheduled backups or sync jobs. For each resource, record the primary owner, backup contact, dependencies and maintenance expectations.
Define successful operation before setting thresholds. Website checks should verify the expected content because a successful status code alone does not establish that the page is correct. An API must return the correct response data. Backups must complete successfully before their deadlines. Services presenting certificates need a renewal owner and an agreed warning window.
These definitions should guide incident creation and tell the responder what action to take.
Establish the monitoring signals
Configure external website and API checks to validate response content. Add certificate monitoring for the relevant services. An incorrect page can still return HTTP 200, so test the content validation as well.
Choose a pilot host that the Linux Sensor supports: Ubuntu or Debian running systemd. Under Settings → Linux Hosts, generate the installation command and run it as root through your approved change process.
Verify that the host has enrolled and is sending CPU, memory, disk and network measurements. Check for recent host entries in Explore / Logs; a completed installation does not establish that collection is working.
Watch representative workload cycles before setting metric thresholds. Base disk alerts on growth and cleanup needs. For CPU and memory, look for sustained pressure and service symptoms rather than applying universal utilization percentages.
Register completion heartbeats for the selected jobs. Each job should send an HTTP POST to its unique heartbeat URL only after completing successfully. Set its expected reporting window using the schedule and observed runtime.
Test detection, response and recovery
Follow the testing guide in an isolated environment or against approved test targets. Change one condition at a time and retain the evidence.
| Test | Expected evidence | Responsible owner |
|---|---|---|
| Incorrect response body | Content check fails despite HTTP 200; incident appears | Application owner |
| Controlled endpoint failure | Failed check creates an incident; responder acknowledges it | Service owner |
| Missing completion heartbeat | Withheld success ping produces a silent-job incident | Job owner |
| Sensor telemetry loss | After the staleness window, sensor.offline appears | Linux administrator |
| Recovery | Restored checks or heartbeats clear the trigger; Sensor reports sensor.online; incident closes | Assigned responder |
| Maintenance suppression | Checks continue while alerts are paused | Monitoring administrator |
| Ownership handoff | Backup responder acknowledges a test incident and identifies the next action | Primary and backup owners |
During incident acceptance, check acknowledgment and resolution separately. Verify automatic closure after the triggering condition clears. Test the documented maintenance-window behavior separately from recovery, so suppression cannot hide a broken check.
Expand only after acceptance
Add services gradually and keep existing monitoring in place while validating the new setup. The migration instructions cover recreating monitors with matching targets and intervals; do not assume an automatic importer is available. Keep historical records accessible as you compare results. Where applicable, the Sensor can coexist with a Datadog host agent during migration.
For structured lab practice, our Cybersecurity course includes 49 scenarios using 24Observe. Students work through device-log normalization, detection and AI-assisted triage before submitting an incident disposition. Networkers Home also offers an AI SOC Analyst course.
Frequently asked questions about server monitoring tools
Can website uptime checks replace server monitoring?
No. External checks test whether a service responds from the checking location. Host collection shows resource pressure and system events inside the server. A reachable website can still have a nearly full disk; a healthy host can sit behind a broken public endpoint.
24Observe is built by our group, so weigh our view accordingly. Its Sensor collects logs and host metrics, which answer different questions from external availability checks.
Do server monitoring tools always need an agent?
No. Agentless collection can use existing management interfaces or network protocols. Zabbix supports options including SNMP, IPMI, SSH, ICMP and TCP. Site24x7 supports SNMP and WMI where installing agents is impractical.
Visibility depends on the collection method. Check which measurements it exposes and what credentials it requires, then confirm that firewalls permit access. Detailed local collection serves a different purpose from an external reachability test.
Which Linux systems support the 24Observe Sensor?
The documented support currently covers systemd-based Ubuntu or Debian hosts. Check support before planning an installation on another Linux distribution.
The Sensor documentation describes a single-command installation with automatic enrollment. Default collection includes journald events and host measurements through OTLP. Follow the setup instructions to generate the installation command, which requires root privileges on the target machine. After installation, verify that telemetry arrives before configuring alerts.
What do the seven named monitoring check types mean?
The table covers seven named check types. Other monitoring methods exist; the check reference provides further context.
| Check | What it tests |
|---|---|
| HTTP/S | Whether a web endpoint responds, and its response time. |
| TCP | Whether a TCP connection can be established. |
| SSL | Certificate validity and approaching expiry. |
| Ping | Whether the target answers ICMP probes. |
| Port | Whether the specified service port is reachable; this overlaps with TCP checks. |
| Keyword | Whether a response contains expected content. |
| Heartbeat | Whether a scheduled process reports within its expected window. |
Match the check to the failure you need to detect. An open port alone does not prove an application works correctly.
Why check page content when HTTP returns 200?
A successful status code can accompany an error message. It can also return an empty page or an incorrect API response. Content checks test for expected information rather than treating HTTP 200 as sufficient evidence.
For JavaScript-dependent pages, distinguish the initial response from the rendered result. 24Observe’s browser monitors execute JavaScript using headless Chromium and inspect the resulting DOM.
How should I monitor cron jobs and backups?
Send the heartbeat after successful completion. A signal that the scheduler started a process does not confirm that the job finished successfully.
The documented heartbeat workflow sends an HTTP POST to the job’s unique URL after success. A missing heartbeat can expose a silent backup or synchronization job. Set the expected window around the schedule and normal execution time.
Can monitoring incidents close automatically after recovery?
Yes. In 24Observe, incidents resolve automatically once their trigger clears. Incident emails also offer acknowledgment and resolution controls.
Recovery-based closure records that the monitored condition has recovered. Remediation means taking corrective action, such as restarting a service. Automatic closure does not establish that the monitoring platform repaired the fault, and the underlying cause may still recur.
Frequently asked questions
What is the difference between server monitoring and website monitoring?
Server monitoring examines the machine and its workload, including processor usage, memory pressure, storage, processes and logs. Website monitoring checks what an external client receives. These views can disagree: a host may respond to network traffic while its website serves incorrect content. Combine internal measurements with response and content checks so an alert can show both the user-visible failure and evidence from the underlying system.
Can you monitor Linux servers without installing an agent?
Yes, depending on the information you need and the access available. Zabbix documents agentless methods including SSH, SNMP, ICMP and TCP checks. Site24x7 also documents SNMP and WMI options for agentless collection. These methods should not be assumed to provide every measurement available from an installed agent. Choose the collection method around required evidence, credentials, network access and who will maintain the configuration.
Which seven basic check types does 24Observe support?
The seven named basic checks are HTTP/S, TCP, SSL, ping, port, keyword and heartbeat. Their purposes include endpoint availability, connection testing, certificate checks, expected content and scheduled-job completion. TCP and port checks have overlapping operational purposes; the supplied documentation does not establish a separate technical distinction. Browser checks are also documented. Treat this list as the named basic set, rather than an exhaustive count of every monitor available.
Does the 24Observe Linux Sensor work on every Linux distribution?
No such universal support is established. The documented Sensor compatibility currently covers Ubuntu and Debian systems using systemd. Its generated installation command runs as root, and the base setup sends journald entries together with host measurements. Before rollout, check the operating system and service manager on each target. Do not assume that support for Linux generally means every distribution, container image or init system is supported.
Is an HTTP 200 response enough to prove that a website or API is healthy?
No. A successful HTTP status can accompany an error message, incorrect page or unexpected response body. Content checks add an assertion about what should be returned. 24Observe documents expected-content checks and verification of a particular JSON field. For pages whose important content appears after JavaScript executes, its browser checks inspect the rendered document. Choose assertions that represent the service's intended behavior, rather than relying on reachability alone.
How does cron job monitoring detect a backup that never runs?
Heartbeat monitoring expects evidence of a successful run within the configured schedule. In the documented 24Observe workflow, the job sends an HTTP POST to its unique heartbeat address after completing successfully. If that expected signal does not arrive, an incident can open. Send the heartbeat after the meaningful work finishes, not merely when the script starts. Otherwise, a failed backup could still appear to have completed.
Does automatic alert resolution mean the tool fixed the problem?
No. Automatic resolution means the incident closes after the condition that triggered it is no longer present. It does not establish what restored service or whether remediation occurred. 24Observe documents this recovery-based closure and provides incident actions through email. During evaluation, test failure detection and subsequent recovery separately. Keep acknowledgment, notification silencing, service repair and incident resolution distinct in your operating procedure and incident records.