Opentelemetry · 24Observe
OpenTelemetry: A Practical Guide for SOC, NOC and SRE Teams
Swipe sideways to see the whole diagram.
What is OpenTelemetry, and what problem does it solve?
OpenTelemetry (OTel) is a vendor-neutral, open-source observability framework for producing, collecting and exporting telemetry, including traces, metrics and logs. It gives applications a shared approach to instrumentation and telemetry transport. Separate backends handle storage, queries and visualization.
Problems arise when services measure themselves differently. One team uses a vendor SDK, another writes custom instrumentation, and a third emits records that need their own parser. Engineers spend time reconciling incompatible formats before they can investigate failures. Changing the destination can also mean repeating integration work across applications.
OpenTelemetry provides common interfaces, conventions and transport, reducing the coupling between application instrumentation and a particular destination. This helps teams retain control of their telemetry without relearning instrumentation for each vendor.
OpenTelemetry is a Cloud Native Computing Foundation (CNCF) project created through the merger of OpenTracing and OpenCensus.
What does each OpenTelemetry component do?
Each component has a distinct responsibility. APIs and SDKs serve different roles, as do the protocol and the Collector; they cannot substitute for one another.
| Component | Responsibility |
|---|---|
| Specification | Establishes the requirements and expected behaviour of OpenTelemetry components. |
| APIs | Provide interfaces that application code uses to generate telemetry. |
| Language SDKs | Implement those interfaces and specification requirements, including telemetry export. |
| Instrumentation libraries | Add telemetry generation to commonly used application libraries and frameworks. |
| Collector | Acts as an intermediary that accepts telemetry, applies processing and forwards it to configured destinations. |
| OpenTelemetry Protocol (OTLP) | Specifies telemetry encoding and the rules for transport and delivery between sources, intermediaries and backends. |
When troubleshooting, identify where the failure sits. Missing instrumentation is a production-side problem, while a misconfigured export destination is a transport problem. Both need to be addressed at their source, rather than through dashboard changes.
Where does OpenTelemetry stop?
OpenTelemetry is not an observability backend. Generating a measurement and delivering it somewhere does not provide a searchable history or a visualization. Downstream tools remain responsible for storage, query execution and dashboards.
Throughout this guide, we use a hypothetical property-listing application as an illustration. It does not represent a customer deployment. Imagine a listing-search service calling a property database and an image service. Without shared instrumentation, each dependency could require different collection logic. With OpenTelemetry, the application can generate telemetry through common interfaces and export it directly or through a Collector. Subject to destination support, switching destinations can then focus on export configuration, leaving application instrumentation unchanged.
Networkers Home was founded in 2007 by Vikas Swami. 24Observe is built by our group, so readers should weigh our view accordingly. The founder explanation describes the multi-tool complexity behind that decision. For related reading, see our explanation of monitoring and observability.
For readers evaluating 24Observe as a destination, the quickstart, Collector documentation and existing-agent options cover ingestion. Its log and metric pages describe destination-side capabilities. Traces enter as a signal feeding its context graph. Assess the destination against the investigations you need to perform, separately from your instrumentation choices.
How do OpenTelemetry traces, metrics and logs work together?
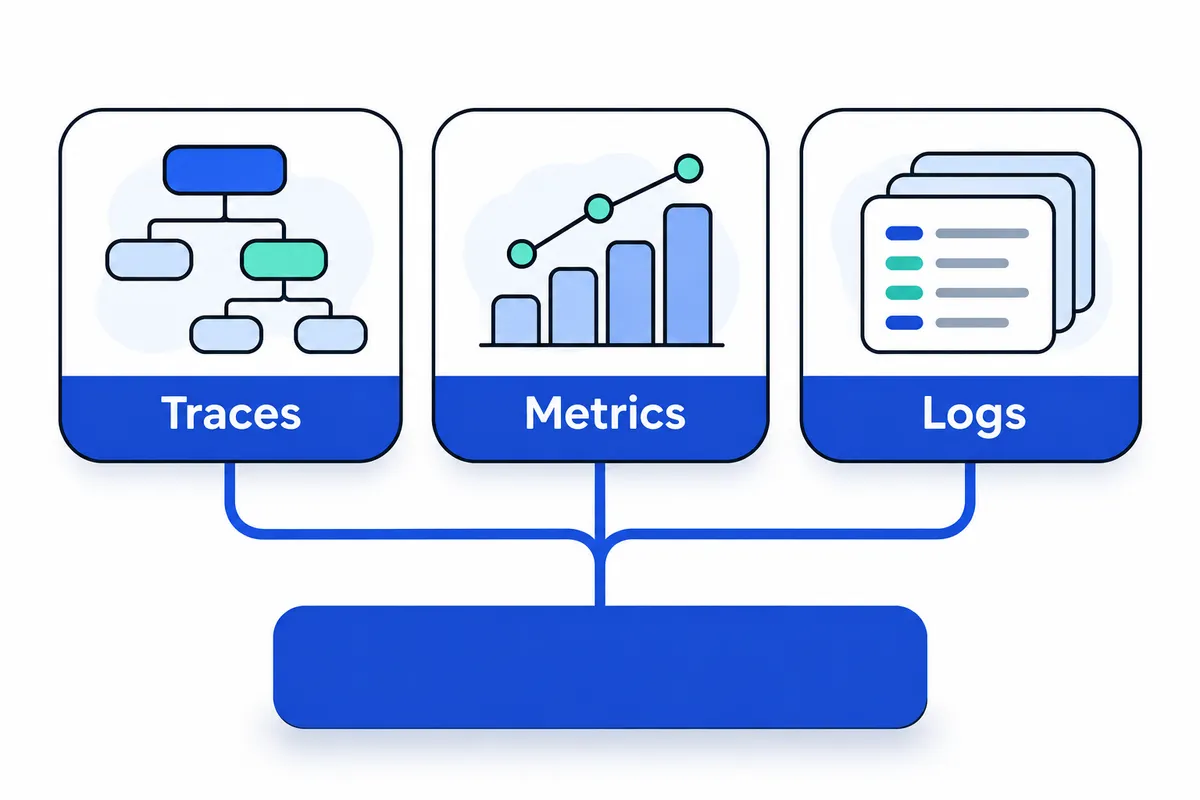
OpenTelemetry traces, metrics and logs describe the same system from different angles. A trace follows a request’s route, metrics measure runtime behaviour, and logs record events. Connecting them through identifiers and source metadata makes them useful during an investigation.
24Observe is built by our Networkers Home group, so weigh our view accordingly. The broader observability model provides context. To see how the signals connect, follow one request.
Follow a property search through the application
Consider a hypothetical property portal. A visitor searches for apartments in Whitefield, Bangalore. The application queries its listings database, returns matching properties and queues a notification confirming that the search was saved.
A trace represents that request’s path. Its individual operations are spans: handling the incoming search, calling the database and publishing the notification job. Each span records its own timing and operation metadata.
The application’s request-handling span can be the parent of the database-call span. That relationship identifies the database call as a sub-operation of handling the search. Each span has a span ID identifying that operation; spans belonging to the same trace share a trace ID. The child records its parent’s span ID to preserve the relationship.
Suppose the database call takes most of the request’s duration. The spans show where this particular request spent time. Aggregated metrics can help identify whether slow property searches form a broader pattern.
A span event marks something significant at a particular moment within an operation. For example, the application could attach a “search validation completed” event to its request span. The event annotates the existing span without creating another timed operation. In distributed tracing, this distinguishes a moment within an operation from the operation itself.
Carry the relationship across the queue
The notification worker may begin after the application has returned its response. Context propagation carries contextual information across execution and service boundaries so instrumentation can preserve relationships. For HTTP calls, trace context can travel through a traceparent header; messaging instrumentation must carry context across the queue boundary.
Depending on the workflow and instrumentation, notification processing might continue the existing trace or start a separate trace with a span link to the producing operation. A link records a causal association without making the linked span its parent. Use it when the relationship does not fit a straightforward parent-child tree.
Keep these four concepts separate in your observability design:
- Propagated context carries information across boundaries, including the span context needed to associate work.
- Baggage carries additional contextual values between operations and signals. It transports context without serving as a storage destination.
- Resource identity describes the telemetry source. Examples include
service.name,service.versionandhost.name. These identify the emitting application or host, rather than an individual search, and remain stable during that application instance’s lifetime. - Instrumentation scope identifies the instrumentation emitting telemetry, distinguishing it from the service or host being observed.
The application and notification worker have separate resource identities even when their work is causally connected. They remain distinct services when they share a trace ID.
Use metrics for patterns and logs for event detail
Metrics are measurements taken while a system runs. In this hypothetical portal, instrumentation could measure search durations, request counts and notification-processing failures. Aggregating those measurements over time helps establish whether degradation is widespread or isolated.
An exemplar can associate a metric observation with trace context, connecting a measurement to an example execution. Check whether the destination stores exemplars and exposes navigation from them before relying on that connection.
Logs are timestamped event records. A notification worker might record that delivery failed, including a failure category and retry decision. OpenTelemetry log records can carry TraceId and SpanId, allowing the event to be associated with the active trace and operation when context is available.
Structured logging requires consistent fields and types. A numeric retry count should remain numeric across emitters, and a failure category should use a predictable field. JSON encoding alone does not establish that consistency. For log management, predictable fields and types help operators compare records across emitters.
| Signal | Diagnostic question | Hypothetical evidence | Correlation mechanism |
|---|---|---|---|
| Traces | Where did this request spend time? | Database-call span dominates search duration | Trace ID, parent span IDs and span links |
| Metrics | Is the problem affecting many requests? | Search-duration measurements rise over time | Resource attributes, time alignment and exemplars where available |
| Logs | What happened during the operation? | Notification failure category and retry decision | TraceId, SpanId, resource identity and timestamps |
Check what the destination actually preserves
OpenTelemetry defines telemetry generation and exchange; investigation views can differ across backends. Before designing a workflow, verify that the destination preserves identifiers, handles resources as expected and supports exemplars.
For example, 24Observe ingests traces as evidence feeding its context graph. Assess its documented signal model, log handling and context construction separately. Preserving trace identifiers in logs does not, by itself, promise a particular navigation experience between signals. During an incident, inspect actual emitted records to confirm those connections rather than assuming the interface will reconstruct them.
Why do OpenTelemetry semantic conventions matter?
OpenTelemetry semantic conventions give teams shared naming rules so they can recognize equivalent operations across languages and technologies. Without that agreement, engineers have to translate each application’s vocabulary before comparing its telemetry with another service’s.
24Observe is built by our group, so weigh our view accordingly when reading the linked documentation and guides.
Separate standard names, business metadata and source identity
A standard attribute name has a meaning defined by the relevant convention. Your team defines the meaning of a custom application attribute. For example, checkout_type needs an internal definition; using that field name does not make it an OpenTelemetry standard.
Conventions cover traces, metrics and logs. Teams need to agree on both the spelling of a field name and what its values represent.
Keep operation metadata separate from resource identity:
- Span attributes describe the work being performed, such as a business-specific fulfilment category.
- Resource attributes identify the source producing telemetry. Standardized examples include
service.name,service.versionandhost.name.
A choice specific to one request should not define the identity of the application handling it. Keep that distinction in mind when reviewing telemetry concepts and interpreting relationships in a context graph.
Run a naming review before expanding instrumentation
Agree on service identity with the application owners first. Decide which name identifies each application and how release and host information will be supplied.
For business-specific metadata, document what each custom field means and which values to expect. Check the relevant OpenTelemetry convention before creating a new name for a concept it already defines. Record who approves changes, along with who maintains the instrumentation and updates queries and investigation guidance.
| Review area | Question to resolve |
|---|---|
| Naming consistency | Do equivalent operations use matching names across implementations? |
| Attribute meaning | Does each field have one definition, understood by producers and investigators? |
| Resource placement | Does the attribute identify the source, or describe an individual operation? |
Several names for one service can split its evidence across groups. A field whose meaning changes between applications can lead investigators to compare unrelated activity.
Build naming checks into initial setup, collection reviews and SRE investigation workflows. Assign an owner to keep those checks current as names and definitions change.
How does OpenTelemetry instrumentation work in each language?
Automatic instrumentation generates telemetry by observing supported libraries or runtime activity, without requiring application-code changes. With manual instrumentation, developers use OpenTelemetry APIs to describe operations specific to their applications. Both support application observability. Our founder at Networkers Home, Vikas Swami, built 24Observe, so weigh our view accordingly when reading that guide.
You can use both approaches together. An incoming request and its database calls may be captured automatically, while manual spans describe the property-search operation that connects them. Library coverage alone cannot establish whether a business workflow is visible. Database activity, for example, does not tell you whether instrumentation covers eligibility filtering, ranking or follow-up work sent to a queue.
Assign responsibilities before following a language-specific setup guide. Providers supply objects used for instrumentation, including tracers, while resources identify the service emitting telemetry. Span processors control what happens to completed spans before export. Exporters deliver them to a destination. A provider commonly lasts as long as the application, though ownership of its initialization varies. These responsibilities need named owners; they do not imply one startup sequence for every application.
Keep specification stability separate from implementation maturity. Each language implementation has its own delivery status against the specification’s contract. Although the specification marks logs as stable, SDK readiness can differ. Existing logging frameworks may connect through appenders or bridges. Developers should continue using their logging framework rather than adopting the Logs Bridge API as an application logging interface. Verify the logging integration independently of tracing.
Java: Establish who owns initialization
Review the Java implementation’s current status for each signal you need. Then check coverage against the framework and the HTTP, database and messaging libraries actually deployed. General language support does not establish coverage for those dependencies.
Give one component responsibility for provider initialization during application startup, including checks for exporter configuration and resource identity. Follow context across request handling, background execution and queue boundaries. For logs, validate the chosen framework integration and inspect the trace and span identifiers it emits. The presence of spans alone does not confirm log correlation.
JavaScript/TypeScript: Define the execution environment
Specify the environment where instrumentation will run before choosing components. Use that environment to check current implementation status and framework coverage. Identify the startup component responsible for initialization and exporter configuration.
Include asynchronous execution and outbound requests when testing context propagation as part of API monitoring validation. Check logging integration on its own. In the supplied documentation snapshot, the JavaScript Logs implementation is listed as in development. Review the current Logs documentation before implementing it; readiness in another language or signal does not establish readiness here.
Python: Validate request and worker paths
Check Python’s current maturity for each signal, along with support for the deployed framework, client libraries and queue libraries. Examine startup for both request-serving processes and workers. For each path, identify who configures providers and resources, and who sets up exporters.
Use concurrent requests and queued jobs to test whether context stays attached to the intended operation. Validate the existing logging framework’s integration by inspecting the identifiers it produces. Python’s Logs implementation is described as in development in the supplied documentation snapshot, so review current documentation before selecting a production logging path.
Go: Verify each signal independently
Assess Go’s implementation status separately for each signal. Compare instrumentation coverage with the dependencies the application uses, and identify operations that need application-owned instrumentation because library instrumentation cannot explain them.
Make ownership of initialization and exporter settings explicit. Test context propagation into downstream calls and queued jobs, then check how application logs enter the telemetry pipeline. The supplied documentation snapshot gives Go’s Logs implementation release-candidate status. Verify that status before implementation, without treating the label as evidence of feature parity with another language.
.NET: Make startup ownership explicit
Review current .NET implementation maturity and coverage for the deployed framework, outbound clients, persistence libraries and messaging components. Identify the startup component that initializes providers and resources. Establish where exporters obtain their destination settings.
Test context through request handling and background processing. Check logging integration separately, inspecting records for the intended request identifiers. No .NET-specific maturity label appears in the supplied facts. Use current implementation documentation rather than applying assumptions drawn from Java, Python or Go.
When sending to 24Observe, verify the receiving path with its initial setup guide and collector configuration reference. The telemetry concepts documentation covers ingestion. Its context-graph documentation explains how evidence about callers and callees from ingested traces contributes service relationships. Assign destination configuration separately from responsibility for application instrumentation.
Walkthrough: Property search across a queue
Send a test property-search request and check that supported instrumentation records it alongside the relevant dependency calls. Wrap the search operation in a manual span. Add child spans only for application-specific stages that need explanation. Include useful attributes that contain no sensitive information, then inspect search-related logs for identifiers belonging to the active operation.
Enqueue the follow-up work with the relevant context still active. Check whether queue instrumentation handles context injection and extraction, and explicitly cover any boundary it misses. At the worker, examine the producer-to-consumer relationship against the context-propagation model. Verify that the consumer represents the intended causal relationship and that its logs identify its active span. Also inspect an unrelated job to ensure it has not inherited context from the search request.
How does the OpenTelemetry Collector process telemetry?
The OpenTelemetry Collector runs as a separate service between telemetry sources and destinations. It receives telemetry, processes it according to configuration and forwards the results. Downstream tools provide the database and dashboards used to store, query and visualize that data.
Operators can adjust Collector processing through configuration. This also adds a service that needs configuration, security controls, monitoring and maintenance.
Follow the data: receivers, processors, exporters
Receivers bring data into the Collector. A push-based receiver accepts telemetry from applications or other sources; a pull-based receiver retrieves it from a configured source. Receivers convert supported input formats into the Collector’s internal representation so subsequent stages can use a common data model.
For applications that already write local logs instead of exporting through an SDK, collection can begin at the file. The filelogreceiver reads those files and can parse their contents, including with regular expressions.
Processors modify telemetry before it leaves the Collector. They can discard unwanted records, attach attributes or transform content. For example, the transformprocessor can extract nested data, flatten structures and modify values. Batch processing collects items for periodic export rather than transmitting them individually.
Exporters convert the internal data model to the format a destination expects, then deliver it. The outbound wire format can differ from the input: supported exporters can send logs in formats outside OpenTelemetry.
| Component type | Responsibility | Supplied example | Operational check |
|---|---|---|---|
| Receiver | Accept pushed data or retrieve it from a source | Push-based or pull-based collection | Can the source reach the receiver, or can the receiver access its source? |
| Receiver | Read and parse local logs | filelogreceiver | Are file permissions and parsing rules correct? |
| Processor | Reshape telemetry and modify values | transformprocessor | Do representative records retain the fields investigators need? |
| Processor | Remove unwanted telemetry | Filtering before export | Are useful security or failure events being discarded? |
| Processor | Group telemetry before sending | Batch processing | Does the configured interval fit the operational need? |
| Exporter | Convert and deliver outgoing data | Destination-specific output format | Does the destination accept the format and credentials? |
Connectors and extensions are separate component categories. Check the documentation for each; their behavior can differ from these three stages.
Build separate pipelines for each signal
A single configuration file holds the Collector’s components, extensions and service settings. Define a pipeline for each signal, traces, metrics and logs, with the receivers, processors and exporters it requires.
Data moves through the pipeline as receiver → processor → exporter. Check processor order carefully. If a transformation deletes a field, a later filter may make a different decision.
One receiver can feed several pipelines, while a pipeline can accept input from several receivers. Telemetry can also be sent to multiple destinations, allowing parallel evaluation or migration before switching destinations. Check delivery separately at every destination.
Choose placement around the collection requirement
Choose a placement to suit the collection requirement. These options do not form a required progression:
- Direct export: Application instrumentation delivers telemetry to a compatible backend, with no Collector in between. OpenTelemetry documentation describes this as workable in development and smaller environments. It avoids operating a separate Collector service.
- Agent-style placement: Run a Collector beside a service or near its sources when collection needs local file access or processing before transmission.
- Shared collection tier: Send source data to a separately operated collection layer when multiple services need central control over processing or destination routing.
Before removing an existing collection agent, check its source coverage, parsing needs and operational responsibilities. Collector placement alone does not establish that the agent is redundant.
Configure reliability and data protection explicitly
The Collector supports retries, encryption, batching and sensitive-information filtering. Review the relevant settings for your deployment. The availability of these capabilities does not guarantee delivery.
Test what happens during a temporary destination failure, then inspect recovery. OTLP retry rules separate recoverable failures from data that must be discarded, so retrying every rejection is incorrect. Set up encryption on connections that require it. Test that sensitive values are removed before data crosses the intended boundary.
Read the documented stability and signal support for every component before adopting it in production. Maturity differs between components.
Destination-specific example: 24Observe
24Observe is built by our group, so weigh our view accordingly. The Collector documentation covers a destination-specific setup based on the standard contrib distribution. That configuration uses OTLP input, batches data and authenticates outbound delivery. The quickstart covers setup on the receiving platform.
Treat these settings as destination-specific configuration, separate from the Collector’s general behavior. The ingestion concepts identify supported signals. The context documentation explains how ingested traces feed the context graph.
For source planning and validation, use the existing-agent guidance, then consult the log-ingestion reference and metrics reference as needed. Review the administration guidance for destination-specific treatment of sensitive values alongside the filtering policy configured in your Collector.
What is OTLP, and should you use gRPC or HTTP?
OTLP, the OpenTelemetry Protocol, defines how telemetry is represented, transported and delivered between senders, intermediaries such as Collectors, and destinations. It specifies how telemetry is encoded, exported and acknowledged. Both OTLP/gRPC and OTLP/HTTP use Protobuf schemas and exchange export requests with corresponding responses.
Choose the transport your exporter, network path and receiving endpoint support. Neither is universally faster or more secure. Measure performance on your deployment; security depends on how you configure and deploy it.
OTLP/gRPC vs OTLP/HTTP
| Check | OTLP/gRPC | OTLP/HTTP |
|---|---|---|
| Default port | 4317 | 4318 |
| Payload encoding | Binary Protobuf | Binary Protobuf or a JSON representation of the Protobuf schema |
| Request routing | gRPC service and method routing | HTTP POST to signal-specific paths |
| Default signal paths | Uses gRPC methods rather than the HTTP signal paths | /v1/traces, /v1/metrics and /v1/logs |
| Practical compatibility checks | Verify exporter support, a gRPC-enabled receiver and gRPC handling throughout the proxy path | Verify encoding, content type, path handling and HTTP/1.1 or HTTP/2 support throughout the route |
Those HTTP paths are defaults. Deployments can use custom routing when the client and server agree on the configured paths.
For OTLP/HTTP, binary payloads require Content-Type: application/x-protobuf; JSON payloads require Content-Type: application/json. Ordinary application JSON must follow the OTLP message schema and encoding rules to qualify as an OTLP payload. A JSON log object and an OTLP/JSON export request are different contracts.
Use gRPC where the complete route supports it. HTTP can be a practical choice where existing infrastructure is configured around HTTP POST routing. Test the actual path through proxies and ingress controls before choosing a transport.
Compression, retries and acceptance
OTLP servers must support uncompressed traffic and gzip. An OTLP/HTTP client compressing its request body must send Content-Encoding: gzip. Confirm that compression survives intermediary handling. The header alone is insufficient: the content must actually be compressed.
Check delivery handling as carefully as connectivity:
- Inspect the response body. HTTP
200can accompany either full acceptance or partial acceptance. The status code alone does not establish that every record was accepted. - When the response populates
partial_success, the client must not retry that request. Investigate the rejection information instead. - Retry selectively. OTLP/HTTP permits retries for
429,502,503and504. Other4xxand5xxresponses are non-retryable, including400; clients must discard the affected telemetry rather than repeatedly resend it. - Clients must throttle when a receiver signals overload. Failed HTTP connection attempts should use exponential backoff, with random jitter required between retries.
Acknowledgement covers one connection hop. When an application receives an acknowledgement from a Collector, it confirms that exchange only. Acceptance by the final backend remains unconfirmed. If telemetry arrives but its acknowledgement is lost, a retry can create duplicates. OTLP therefore does not establish exactly-once delivery.
For multiple destinations, keep queues, acknowledgement handling and retry behaviour separate so that one struggling receiver does not block the others.
Check the destination contract separately
Protocol support does not establish what a particular endpoint accepts. Verify the transport, encoding, authentication, base path and signal-specific rules independently.
For example, 24Observe is built by our group, so weigh our view accordingly. Its Collector instructions describe a bridge for gRPC exporters. Check the connection guide for destination configuration, and use the API documentation to check the endpoint contract. General OTLP/HTTP encoding options cannot substitute for endpoint-specific instructions.
Cross-check the relevant log ingestion instructions and integration guidance, especially when documentation describes different ingestion routes. Establish a baseline with the quickstart, then validate receipt using documented ingestion tests. During a backend change, review the migration configuration as well. Verify telemetry acceptance separately from endpoint reachability and a successful transport exchange.
How do you roll out OpenTelemetry across a real application estate?
An application estate spans services, hosts, runtimes and dependencies operated by different teams. For our hypothetical property-listing application, that includes the web frontend, listing API, search service, database, image-processing queue, worker processes and their hosts. Build the rollout around an investigation you need to perform, and agree on acceptance criteria and rollback decisions before making changes.
-
Inventory components and name their owners.
Record each service’s runtime, deployment location, dependencies, existing telemetry and responsible team. Include queue producers and consumers, along with the hosts running workers. Identify who can change application code, network rules and Collector configuration.
Assign a telemetry-pipeline owner separately from application owners. Someone must handle collection, credentials, upgrades and delivery failures after the pilot ends.
-
Define the investigation before choosing instrumentation.
Start with a concrete question: “Why does a newly published listing appear without its images?” Map the evidence needed across the listing API, queue, image worker and host.
For an example of SRE investigation context, see 24Observe, built by our group, so weigh our view accordingly. Judge the rollout by whether engineers can investigate the chosen failure.
-
Document destination requirements.
For each intended destination, verify supported signals, transport, encoding, authentication, permissions, retention requirements and ingestion limits. Document these requirements explicitly. An OTLP label alone does not establish that every configuration will work.
If evaluating 24Observe, start with the setup guide and check the destination-specific log ingestion documentation. Leave destination comparisons to the dedicated section; this step establishes the delivery contract.
-
Agree on identity and naming.
Choose stable
service.namevalues such aslisting-apiandimage-worker. Define how service versions, environments and hosts will be identified. Keep a service’s identity distinct from the machine hosting it.Resources identify telemetry sources. Consistent conventions make those identities usable across signals. For a 24Observe pilot, review its signal and entity concepts before deciding how application and infrastructure identities should align.
-
Select one representative pilot, with a logs-first option.
Pilot listing publication through the API, queue and image worker on a limited deployment slice. This covers a synchronous request, asynchronous work and host evidence without involving every service.
Adoption can begin by collecting existing logs through a Collector. Normalize timestamps, severity and source identity first. Add tracing and metrics as separate changes; there is no need to instrument every signal at once.
-
Place the Collector and assign operational responsibilities.
Decide whether collection belongs alongside services, at host level, through a shared Collector tier, or in a combination. OpenTelemetry generally recommends collection near the service. Base placement on access, isolation and operational ownership.
The OpenTelemetry Operator and Helm Charts are available Kubernetes tooling. For a 24Observe path, consult its Collector configuration guidance. Assign responsibility for configuration reviews, capacity, credentials and sensitive-data filtering. Check destination controls against the administration guidance.
-
Instrument the workflow across its boundaries.
Combine zero-code instrumentation with code-based instrumentation where the investigation needs business-operation detail. Cover HTTP handling, outgoing calls, database access and queue operations. Instrumenting only the API entry point leaves the rest of the workflow outside that coverage.
Test context transfer from the producer into the worker’s processing operation. Inspect log correlation where the selected runtime and configuration support it. In 24Observe, ingested traces feed the context graph as an evidence signal. Evaluate that evidence against the investigation defined for the pilot.
-
Validate transport while preserving the existing destination.
Check the application-to-Collector connection separately from the Collector-to-destination connection. Confirm protocol, endpoint, encoding, credentials and actual downstream arrival. An OTLP acknowledgement covers one connection. Delivery across the whole pipeline needs separate verification.
Keep the current destination during evaluation. An existing Collector can add a 24Observe exporter without re-instrumenting services. Where appropriate, use independent destination queues, acknowledgement handling and retries so a failing evaluation destination does not obstruct the existing one.
-
Review data against proposed acceptance gates.
Generate identifiable test activity, then inspect the resulting records. Use telemetry testing guidance when validating a 24Observe path. Its synthetic tests use actual ingestion and can create incidents and consume usage.
The following checks are proposed acceptance gates. No measured outcomes are presented here:
Gate Evidence required before expansion Expected service identity Pilot records show the agreed service, version, environment and host attribution. Consistent trace context Instrumented request boundaries and queue processing show the intended causal relationship. Useful log fields Records contain usable timestamps, severity, source identity and relevant operation context. Visible metrics Selected application and host measurements can be queried for the pilot interval. Successful downstream ingestion Test records are retrievable at every intended destination, beyond Collector receipt. No prohibited sensitive values Reviewed records contain no credentials, access tokens, private contact details or other forbidden values. For a logs-first phase, explicitly defer trace and metric gates until those signals enter scope.
-
Test failure behaviour and rehearse rollback.
In a controlled environment, interrupt a destination, reject credentials and restart collection. Inspect retries, delivery gaps, duplicates and application behaviour. With two exporters, test each destination’s failure independently.
Agree on rollback triggers before production changes: application regression, sensitive-data exposure, unexpected volume or loss of existing telemetry. Decide whether rollback means disabling new instrumentation, restoring Collector configuration or removing only the added exporter. Name the person authorized to act.
-
Expand in stages and hand over operations.
Expand from the pilot to adjacent search services, additional workers and remaining hosts. Repeat the relevant gates for each runtime and deployment pattern. One successful path does not establish that the rollout works across the estate.
Hand over versioned configuration, ownership records, credential procedures and a pipeline runbook. Application teams should own instrumentation correctness. The designated platform or SRE team should operate collection and delivery, with security reviewing prohibited-data rules. Record exceptions and deferred signals before approving the next deployment stage.
Which OpenTelemetry mistakes cause missing, costly or sensitive data?
Successful export tells you little about whether a pipeline delivers complete evidence, keeps volume under control or excludes sensitive fields. Check what you collect and discard, then inspect what leaves your environment.
24Observe is built by our group, so weigh our view accordingly. It ingests traces as evidence for its context graph. Assess the destination-specific examples below against your own requirements.
Unbounded dimensions and indiscriminate attributes
Metric cardinality is the number of distinct dimension combinations. Highly variable dimensions multiply those combinations. Request IDs, user identifiers and raw URLs can split an aggregate measurement into many separate series.
Choose bounded dimensions that answer operational questions, such as operation category or response class. Use route templates in place of paths containing individual identifiers. Estimate how many combinations the dimensions produce together; checking each dimension in isolation misses their combined effect. Those combinations add processing and storage requirements. Their effect on billing depends on the destination.
Apply the same discipline to attributes. Copying whole headers, payloads or application objects into spans and logs adds volume and exposure, often without helping diagnosis. Build an allowlist around the questions an investigation needs to answer. Include field usefulness alongside message structure in your log-management review.
Broken propagation and duplicated instrumentation
Related operations can appear disconnected when trace context fails to cross a service or messaging boundary. Test context injection and extraction at every boundary, including asynchronous work. Follow a known request to check its trace identity and parent relationships. Make propagation checks part of your distributed tracing review. Successful export alone does not establish that context survived.
Automatic and manual instrumentation can coexist. Inspect where their coverage overlaps: two instrumentation paths watching the same operation can produce duplicate spans or repeated measurements. Inventory the enabled libraries and agents, and assign each operation a clear instrumentation owner. Before expanding deployment, compare the telemetry emitted with the operations you expected to observe.
| Mistake | Consequence | Prevention |
|---|---|---|
| Highly variable metric dimensions | Excessive distinct combinations | Use bounded categories and route templates |
| Copying attributes indiscriminately | Larger payloads and unnecessary exposure | Allowlist fields with an investigation purpose |
| Broken context propagation | Disconnected request evidence | Test context across service and queue boundaries |
| Overlapping instrumentation | Redundant telemetry and misleading counts | Inspect coverage and remove duplicate emitters |
| Sampling without evidence requirements | Important traces disappear | Test selection rules against representative failures |
| Exporting sensitive fields | Data crosses an unintended boundary | Minimize collection and filter before export |
Unsuitable sampling
Sampling involves engineering trade-offs and is optional for cost control. Low-volume workloads producing small traces may see little benefit. When aggregate measurements are enough, consider pre-aggregation instead of keeping evidence for individual requests.
Head sampling makes an early decision from the information available then, before the completed trace can be inspected. Attributes that should influence SDK sampling therefore need to exist when the span starts. An earlier decision cannot account for a failure discovered later, so head sampling cannot guarantee retention of every error trace.
Tail sampling evaluates all or much of a trace before deciding. It can consider evidence across multiple spans, including errors or overall latency. This requires state: spans need grouping and buffering until a decision is made. Account for that processing and storage in your budget. Monitor resource pressure and review the policies as traffic changes.
Using head sampling before tail sampling can lower pipeline load. The tail stage, however, can only evaluate evidence retained upstream; discarded spans cannot reappear later. Filtering and sampling also serve different purposes. A rule that removes unwanted records does not necessarily leave a representative sample.
Sensitive telemetry and filtering at the wrong boundary
Begin by minimizing collection. Check log bodies, span attributes and baggage for credentials or tokens, personal information and request content you do not need. Review baggage explicitly because it carries context between components.
The Collector supports filtering before export, while its transform processor can change or remove values. Place these operations ahead of the outbound exporter whenever information must stay within your environment. Consult the documented Collector configuration for a concrete deployment reference.
Destination-side processing provides a separate control. Redacting data at ingestion cannot reverse its transmission to the destination. The 24Observe administration documentation describes redaction in the sending environment and during ingestion, before persistence. Assess log ingestion separately from your redaction requirements. Acceptance of a record tells you nothing about how sensitive fields are handled, and neither ingestion nor redaction alone guarantees protection for arbitrary payloads.
Test the rules using synthetic sensitive values, then inspect the records leaving your environment and those stored at the destination. The 24Observe documented ingestion tests perform real ingestion and count toward usage. Keep that validation traffic deliberate.
Where does OpenTelemetry data go after collection?
OpenTelemetry generates and transports telemetry, leaving storage, queries and visualization to external backends. Collected data can go to a single destination or several. Choose destinations based on the investigations you need to run, then check the connection requirements for each signal.
24Observe: logs, metrics and incident context
We list 24Observe first because its documented ingestion and incident-context workflow are relevant to this discussion. 24Observe is built by our group, so weigh our view accordingly. Assess it against your investigation requirements; the order here does not represent an independent ranking.
24Observe accepts OpenTelemetry logs and metrics. Its monitoring and security capabilities share storage and incidents, so investigations can use correlated evidence. The 24Observe ingestion documentation describes incoming data. The metric-alert documentation explains how to connect incidents triggered by metrics with nearby logs and events.
Traces supply signals to its context graph. The documented context-graph behavior includes deriving dependencies between services from caller-to-callee relationships in traces. The context-engine documentation covers scheduled graph construction using telemetry and operational records. Assess whether that evidence supports your investigations. Acceptance of spans alone does not establish every capability those investigations require.
The documented hosted ingestion endpoint has api.24observe.com as its host and /api/v1/otlp as its base path. For gRPC exporters, the supported route is the Collector bridge, which sends telemetry to the HTTP API with authentication.
The documentation conflicts on direct HTTP Protobuf ingestion. The Collector documentation says it accepts JSON and binary Protobuf directly. Both the API reference and the log-ingestion documentation describe v1 reception as JSON-only, with Collector translation required for HTTP Protobuf. Before configuring production export, check the current receiver contract for the signal, encoding, authentication and endpoint paths. An OTLP label alone does not confirm acceptance.
There is also self-host deployment guidance. Review it separately, since documentation for self-hosting does not establish that its operating requirements or behavior match the hosted endpoint.
Compare destinations by the evidence you need
| Destination | Strongest evidenced fit | Deployment or connection model | What remains to verify |
|---|---|---|---|
| 24Observe | Logs and metrics supporting correlated incident investigations; traces supplying graph context | Hosted HTTP ingestion, supported Collector bridge for gRPC, and documented self-host deployment guidance | Current receiver contract, signal handling and self-host operating requirements |
| Jaeger | Trace-focused evaluation | External backend connected through the telemetry pipeline | Backend receiver compatibility, export configuration and trace-investigation requirements |
| Prometheus | Metrics-focused evaluation | External backend connected through the telemetry pipeline | Metrics connection method, representation and required queries |
| Site24x7 | Analysis of multiple signals with monitoring correlation | Collector OTLP exporter targets the vendor endpoint using a license key | Current endpoint, authentication configuration and required correlation behavior |
Jaeger, Prometheus and Site24x7: different evaluation priorities
Consider Jaeger when evaluating trace-focused investigations. OpenTelemetry lists it as a compatible backend, and Jaeger formats are supported by the Collector. An SRE investigating request paths should send representative traces and check that useful parent-child relationships reach the backend. A Collector’s receiver support alone does not establish the outbound connection required by the destination.
Prometheus suits a metrics-focused assessment. Connect it through the telemetry pipeline as an external backend, then validate the measurements needed to answer operational questions. A NOC engineer should check that exported measurements retain the names, attributes and aggregation needed to separate a service-wide trend from a problem on one host. Verify the connection method for that backend; destinations do not necessarily consume the same export.
Site24x7 documents ingestion of logs, metrics and traces through the standard Collector for visualization and analysis. The connection uses an OTLP exporter configured with the vendor endpoint and a license key. Its documentation also describes correlation between OpenTelemetry signals and monitoring data from servers, networks and cloud environments. That makes it relevant for teams assessing telemetry alongside those monitoring domains.
Before committing to a destination, send representative data and check that it arrives in a usable form. Transport success is the first check. Then confirm that the destination can answer the operational question that led you to collect the signal.
OpenTelemetry vs Prometheus: Do you need both?
OpenTelemetry and Prometheus can share a telemetry architecture. OpenTelemetry handles instrumentation, telemetry representation and collection, while Prometheus can continue as a compatible metrics destination. You can add OpenTelemetry without removing a metrics system that already works.
Applications produce telemetry through OpenTelemetry APIs. Language SDKs implement those APIs and manage export. Specifications define signal representations, and semantic conventions provide consistent naming. The Collector receives data, processes it and sends it to configured destinations. Other tools handle storage and visualization.
We list 24Observe, built by our group, first as a backend example because it accepts OpenTelemetry signals. Weigh our view accordingly when evaluating it for your team. In this architecture, it serves a different role from OpenTelemetry’s instrumentation.
| Technology | Purpose in this guide | Established signals | Collection relationship | Decisions still required |
|---|---|---|---|---|
| 24Observe | Example destination providing shared operational context | Logs and metrics; ingested traces supply its context graph | Accepts data from OpenTelemetry | Where signals go, required retention and whether self-hosting fits the team |
| OpenTelemetry | Instrumentation, shared representations and telemetry transport | Metrics, logs and traces; baggage carries context | SDK exports and Collector pipelines; the Collector can use agent-based or collector-based deployment | Instrumentation coverage, processing policies and choice of backend |
| Prometheus | Compatible destination for metrics | Metrics in this comparison | Can act as an OpenTelemetry backend; Prometheus formats are supported by the Collector | Specific integration components, direction of collection and operating arrangements |
Collector receivers generally support push-oriented collection or pull data from a source. This does not establish which directions a particular Prometheus integration supports. Check the receiver, exporter and destination configuration before drawing your pipeline.
Two practical designs
-
Keep the existing metrics path. Leave the Prometheus-connected route in place if it already meets your metrics requirements. Add OpenTelemetry instrumentation for logs and traces, then send those signals to suitable destinations. This approach suits teams that want broader investigation coverage while keeping their current metrics architecture.
-
Standardize instrumentation and collection. Use OpenTelemetry to instrument applications and send their signals through a Collector. Configure a compatible destination for each signal: Prometheus can handle metrics, with other destinations receiving logs and traces. When evaluating 24Observe, review its Collector configuration, ingestion concepts and metric-query API.
Before rollout, record who owns each signal and where it goes. Test a representative service and confirm that the expected measurements arrive. Check parallel routes for duplicate metrics as well. Let the investigation gaps you need to close guide the design; adopting OpenTelemetry does not require a replacement project.
How do you troubleshoot an OpenTelemetry pipeline?
Follow one known test event from source to destination. Change one setting at a time, and record where evidence disappears.
Diagnose each stage in order
- Trigger a known operation to confirm generation. Temporarily export spans or logs to standard output to establish whether instrumentation produces data before investigating network delivery.
- Inspect resource identity:
service.name,service.versionandhost.name. Incorrect identity can make received telemetry look missing when you search for the expected source. - Check propagation by comparing trace IDs and parent relationships across service boundaries. For log correlation, inspect
TraceIdandSpanIdon records emitted during an active span. - Verify receiver reachability from the sending application’s runtime. A test from your laptop cannot establish this. Check DNS, listener binding, network policy and TLS.
- Confirm that both ends agree on transport and encoding: gRPC versus HTTP, endpoint paths, payload encoding and content type. A reachable listener does not prove protocol compatibility.
- Follow the receiver, processor and exporter order to inspect processing decisions. Review sampling, filters, attribute transformations and batching. Check each component’s documented maturity when investigating unexpected behaviour.
- Read exporter response bodies alongside status codes. Investigate partial acceptance and non-retryable errors; the latter require dropping affected telemetry rather than resending it.
- Query the intended destination using the test’s identity and time window. Confirm visibility by verifying stored records and expected fields. An exporter acknowledgment alone does not establish storage.
Transport success and storage verification need separate checks because OTLP acknowledgments apply to individual hops. An intermediary’s acceptance does not establish downstream storage, and HTTP 200 can accompany partial acceptance. When partial_success is populated, clients must not replay that request.
| Symptom | Probable category | Next check |
|---|---|---|
| Absent telemetry | Generation or delivery | Confirm local output, then receiver reachability |
| Disconnected spans | Context propagation | Compare trace IDs and parent IDs across boundaries |
| Absent log correlation | Logging integration or context | Inspect correlation fields during an active span |
| Partial acceptance | Receiver-side rejection | Read partial_success details before changing configuration |
| Duplicate data | Resending after missing acknowledgment | Compare retry activity with repeated records |
24Observe example: verify the documented test
24Observe is built by our group, so weigh our view accordingly. Its Collector instructions use telemetrygen to generate five traces. Check the Logs view, or query through the API, using service:telemetrygen. This verifies searchable test data. Traces feed its context graph, and the test does not establish a dedicated tracing interface.
The documented exporter adds signal-specific paths automatically. Do not append those suffixes yourself. For self-hosted service failures, consult the troubleshooting runbook.
Pilot checklist before expanding
- Record the test operation, source identity and expected destination.
- Verify propagation, stored fields and sensitive-data handling.
- Test rejection and retry behaviour; reconcile duplicates.
- Assign an owner, rollback plan and repeatable checks, using test guidance where applicable.
Readers seeking guided practice can explore our optional AI SOC Analyst course.
OpenTelemetry FAQ: practical answers before you deploy
Deployment decisions span four layers: specification, language SDK, transport and backend. 24Observe is built by the Networkers Home group, so weigh that connection when reading its examples below.
Is OpenTelemetry free, and does it include dashboards?
OpenTelemetry is open source and vendor-neutral. It generates, collects and exports telemetry. Storage and visualization belong to an observability backend, so you still need to evaluate retention, query capabilities and dashboards separately. Include log-management requirements in that evaluation. Open-source collection does not make the whole deployment free: budget for running the collection pipeline and whichever backend you select.
Are OpenTelemetry logs stable enough for production?
Logs have stable status in the OpenTelemetry specification. Language implementations have their own maturity levels. The referenced documentation lists Go’s logging API/SDK implementation at release-candidate stage, while JavaScript and Python implementations remain in development. Check the implementation and logging bridge you intend to deploy instead of applying the specification’s stability label to every SDK. Then validate the record fields and confirm that context correlation and export behavior work as expected.
Do I have to deploy an OpenTelemetry Collector?
No. Development deployments and smaller environments can send telemetry without a Collector when the exporter and destination support the required connection. Use a Collector when you need centralized batching, retries, encryption or filtering of sensitive fields. Those operational requirements should determine whether you deploy one. Before rollout, review the destination’s documented setup, such as this Collector configuration.
Should I choose OTLP/gRPC or OTLP/HTTP?
OTLP defines both transports. The default ports are 4317 for gRPC and 4318 for HTTP. Check what your exporter and receiving endpoint support, along with what the network path allows. Verify payload encoding separately, since protocol support alone does not establish compatibility with every backend. For example, 24Observe’s API uses OTLP/HTTP, while its supported route for gRPC exporters passes through a Collector. Consult its API documentation for endpoint-specific requirements.
Can I use automatic and manual instrumentation together?
Yes. OpenTelemetry permits zero-code instrumentation alongside instrumentation written into application code. Zero-code options expose activity from supported libraries or the runtime; code-based instrumentation can describe application-specific operations. Decide what each approach should capture before enabling both. During a deployment test, follow one representative request. Inspect its emitted spans and attributes, check the context, and confirm which business operations the automatic instrumentation captures.
Will sampling preserve every trace containing an error?
Head sampling alone cannot ensure that every error-containing trace is retained. It makes the decision early, without examining the complete trace. Tail sampling evaluates all or most spans and can select traces using error or latency criteria. It requires stateful processing and enough capacity to hold incoming data. When designing distributed-trace sampling, account for those requirements and test the policy against failures you need to investigate.
Can I change backends without instrumenting everything again?
OpenTelemetry’s vendor-neutral design supports changing telemetry destinations. Backend queries, storage and analysis remain separate concerns. For evaluation, 24Observe documents an OpenTelemetry integration and a parallel-export approach that adds another Collector destination. It ingests traces as a signal feeding its context graph; this ingestion does not make it an APM product. Before switching destinations, validate each signal and the investigation workflows you need.
Frequently asked questions
What is OpenTelemetry in simple terms?
OpenTelemetry is an open-source toolkit for producing telemetry and moving it to tools that can analyze it. Its APIs, SDKs, instrumentation libraries, Collector and protocol provide common building blocks across applications and environments. It covers traces, metrics, logs and contextual information. It does not supply the storage and visualization layer itself, so you still need an appropriate destination for operational analysis.
Do I need the OpenTelemetry Collector?
Not always. An application can export telemetry directly to a suitable destination, and OpenTelemetry documentation allows for this in development or smaller environments. A Collector becomes useful when you need a separate layer for batching, retries, filtering or routing to multiple destinations. Choose its placement according to your operating requirements, and remember that the Collector introduces another component your team must configure and maintain.
What is the difference between OTLP/gRPC and OTLP/HTTP?
Both transport OpenTelemetry data using the OTLP specification. The gRPC transport uses port 4317 by default, while the HTTP transport defaults to 4318. OTLP/HTTP can carry either binary Protobuf or the corresponding JSON representation. Choose according to sender support, destination requirements and network compatibility. Matching the port alone is insufficient: encoding, request paths and the receiving endpoint's contract also need to agree.
Are OpenTelemetry logs stable in every language?
The logs signal is stable in the OpenTelemetry specification, but that does not establish identical maturity across language implementations. In the supplied documentation snapshot, the Go Logs API and SDK are a release candidate, while the JavaScript and Python implementations remain in development. Check current language documentation before implementation. Also review the integration path for your existing logging framework rather than assuming all applications require the same changes.
Does OpenTelemetry replace Prometheus?
It does not have to. OpenTelemetry provides instrumentation and telemetry-pipeline components, while Prometheus is one of the compatible backends identified in the documentation. A team can retain its existing metrics arrangement while introducing OpenTelemetry for additional instrumentation or other signals. Decide which component owns each responsibility before changing the architecture. Adopting a common telemetry framework does not, by itself, require replacing a working destination.
Should I use head sampling or tail sampling?
Head sampling makes its decision early and does not evaluate the complete trace. It therefore cannot guarantee retention of every trace containing an error. Tail sampling considers all or much of a trace, allowing decisions based on evidence gathered later, but requires state and processing capacity. Choose according to the evidence you need and the pipeline you can operate. Sampling is not automatically appropriate for every workload.
Can I send existing OpenTelemetry data to 24Observe?
Yes. 24Observe, built by our group, accepts OpenTelemetry logs, metrics and traces. Its documented Collector route supports gRPC exporters and can be added alongside an existing destination. Traces supply evidence to its context graph; it is not an APM, distributed-tracing or RUM product. Confirm the current endpoint and encoding requirements before connecting, because the supplied documentation contains differing statements about direct HTTP Protobuf acceptance.