Synthetic Monitoring · 24Observe
Synthetic Monitoring: A Practical Guide to Checks, Tools and Rollout
Swipe sideways to see the whole diagram.
What is synthetic monitoring and how does it work?
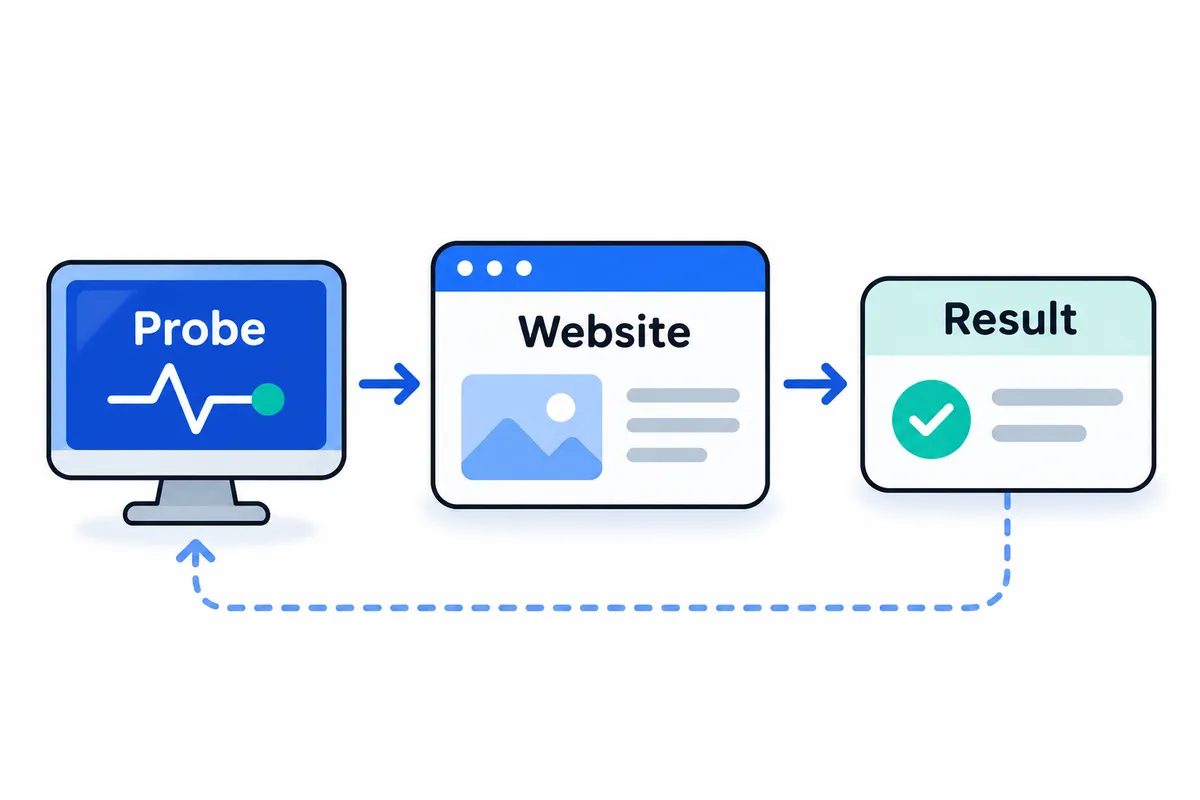
Synthetic monitoring runs controlled requests or user actions against a system, then checks whether the observed results meet expectations. A check might verify that a URL responds or that an API returns usable data. It can also test whether a customer can complete a defined task. Checks run on a schedule rather than waiting for someone to report a problem.
Consider a customer portal that returns HTTP 200 but displays an empty account panel because its data request fails. A status-only check can pass while the customer remains unable to view account information. Endpoint availability and task completion are different conditions, so the monitor needs to test the one that matters.
For this example, we can organise the monitoring loop into the following parts:
| Part | What it does in the portal example |
|---|---|
| Probe | An automated runner generates the request or browser action. An uptime probe can establish reachability; testing the visible account panel requires a browser-level check. |
| Target | The probe addresses the portal URL or an account-data endpoint. For related reading, see our API monitoring guide. |
| Assertion | A rule defines success, such as expected account information appearing after JavaScript executes. This is where rendered-page checks differ from inspecting an HTTP response alone. |
| Result | Each execution records whether expectations passed, alongside relevant timing and errors. Reviewing recent check results helps distinguish a failed assertion from a connection problem. |
| Response | A failure meeting the configured alert policy prompts investigation or an incident workflow. Later executions establish whether the tested condition has recovered. |
This is black-box testing: the probe judges externally observable behaviour without needing to inspect application code. It can expose a broken customer path, though the failed check alone may not explain the underlying cause.
When these functional checks run against the live service, they are production tests, often called test-in-production. Use dedicated test accounts and controlled data. Avoid actions that create unwanted transactions or expose sensitive information. Scheduled synthetic checks verify selected behaviours repeatedly; they do not replace load testing, which examines behaviour under deliberately generated demand. For the reachability layer, start with uptime monitoring basics.
Start an evaluation by defining the behaviour you need to verify. Then consider the evidence a failed check provides and how your team should respond. 24Observe is built by our group, so weigh our view accordingly. Its monitoring and incident workflow use shared data and incidents. Assess that design against your own operational requirements rather than treating it as evidence of a universal ranking.
Real user monitoring vs synthetic: which do you need?
Linked reading is from 24Observe, built by our group at Networkers Home, so weigh our view accordingly.
Synthetic checks deliberately exercise selected scenarios; real user monitoring (RUM) observes actual sessions. Use synthetic checks to verify critical paths even when nobody is visiting. RUM shows what customers experience across their devices, networks and behavior. Critical customer journeys generally need both perspectives.
| Dimension | Synthetic monitoring | Real user monitoring |
|---|---|---|
| Data origin | Requests and interactions generated by configured probes | Telemetry from actual user sessions |
| Coverage without traffic | Tests configured paths regardless of customer activity | No fresh evidence for paths nobody visits |
| Repeatability | Consistent scenarios support comparisons over time | Changing traffic and usage complicate comparisons |
| Blind spots | Untested devices, networks, session states and behaviors | Unvisited paths and sessions outside instrumentation |
| Operational use | Availability alerts and repeatable performance baselines | Investigating observed customer experience and affected user groups |
A predictable probe repeats the same actions with a defined configuration. Its response-time baseline is useful for comparing releases or spotting deterioration, though the probe cannot represent every customer. A passing result confirms that the tested scenario worked under those conditions. Other sessions may still fail.
Two incidents that need different evidence
Consider a quiet regional login endpoint that develops a certificate fault overnight. Nobody visits that route, so traffic-dependent monitoring has no failed session to observe. A scheduled probe targeting the regional route can expose the failure before customer traffic returns. A probe aimed only at another region would miss it.
A device-specific problem needs different evidence. Customers using a particular mobile browser might be unable to submit the login form while the configured desktop probe passes. Depending on instrumentation, RUM can reveal the affected browser group and observed failures. Responders can reproduce that configuration and examine relevant server logs. Adding a targeted synthetic scenario then provides continuing coverage for the reproduced defect.
Keep monitoring, release testing and load testing separate
Production journey checks ask whether selected customer actions work now. Using controlled accounts and data, they can verify successful requests and expected rejection of invalid input.
Pre-release functional tests assess whether a candidate change behaves correctly before deployment. Deliberate load tests generate planned traffic to examine capacity and behavior under demand. A scheduled journey check may observe slowdown during busy periods; load testing requires deliberately generated traffic.
Keep production monitoring focused on live service evidence and actionable alerting. When evaluating tools, verify RUM separately: synthetic browser support does not establish RUM availability.
How do uptime monitoring, API monitoring and browser checks differ?
Choose the check based on the question you need answered. Network reachability tells you whether a host or port responds. HTTP uptime checks whether a URL responds as expected. API checks examine application responses, while browser checks evaluate what loads after JavaScript executes. Transaction checks test whether an action produces its intended result.
The linked resources cover 24Observe, built by our group, so weigh our view accordingly. The table describes monitoring patterns. Support for each pattern needs to be checked against the individual product.
| Check type | Action | Useful assertion | Example failure | Blind spot |
|---|---|---|---|---|
| HTTP uptime | Request a URL without rendering it. | Expected status, response content and acceptable duration. | A service endpoint returns a server error. | Successful HTML delivery does not prove that the interface works. |
| Network reachability: TCP or ping | Attempt a TCP connection or send an ICMP probe. | The target port accepts connections, or the host answers. | A firewall blocks the application port. | Reachability says little about application correctness; ICMP may also be intentionally blocked. |
| Certificate checks | Inspect the certificate presented during a TLS connection. | Expiry remains outside the warning window; identity matches the hostname. | A certificate approaches expiry or belongs to another hostname. | A valid certificate cannot establish that an application function succeeds. |
| API requests | Send a request with appropriate headers, credentials and payload. | Returned fields, object identity and error behaviour match expectations. | An API returns the wrong object despite a successful status. | Direct requests bypass browser rendering and client-side behaviour. |
| Rendered-browser checks | Load a page in a browser and execute JavaScript. | Required content appears in the rendered page. | A page shell loads without its client-rendered content. | A page-load assertion does not prove that subsequent interactions work. |
| Single transactions | Perform one bounded business action through an API or interface. | The action produces the intended observable result. | A submission is accepted but creates no record. | Adjacent stages of the workflow remain untested. |
| Multi-step journeys | Execute connected requests or interactions while preserving state. | The final result belongs to the session and data created during this run. | Login succeeds, but completing an order fails. | Untested branches and account conditions remain outside coverage. |
| Heartbeat monitoring | Receive a completion signal from a scheduled process. | A success signal arrives before its deadline. | A scheduled export never reports completion. | A signal sent prematurely can conceal unfinished or incorrect work. |
An API transaction is different from a browser journey
A synthetic transaction attempts a meaningful task automatically, using controlled test inputs, then checks that the expected outcome occurred. Here, “transaction” refers to a business action; it need not involve a database transaction.
For example, an API transaction might create a test record, retrieve it and verify its identity and contents. A browser journey might sign in, enter details, submit a form and confirm that the record appears. Both test application behaviour. The browser journey also exercises the interface and its client-side execution.
A multi-step flow must carry state between steps, whether that means authentication tokens, cookies, generated identifiers or previously selected values. Passing each request independently does not establish that the journey works. Check the final business result and confirm that it belongs to the correct test account. Include rejection checks for inputs that should fail.
The monitoring concepts documentation explains the monitor types. In 24Observe, HTTP and keyword checks inspect response bodies, while rendered-browser checks examine content after JavaScript execution. These capabilities alone do not establish support for arbitrary scripted journeys.
Heartbeats reverse the direction of the check
With heartbeat monitoring, the workload reports completion to the monitor. The monitor waits for that signal rather than starting a task or simulating a user. Teams often run heartbeats alongside synthetic checks to catch scheduled work that fails to report completion.
Send a scheduled-job heartbeat only after validating that the work has finished. Sending it at startup can hide unfinished work. In 24Observe’s documented workflow, an incident opens when the deadline and configured grace allowance have passed without a heartbeat; the next heartbeat resolves it. Because the signal confirms what the job reports, its position in the workflow determines how reliably it represents correct completion.
What should browser monitoring and synthetic transactions test?
Test customer actions whose failure would block access, prevent a purchase or interrupt essential work. Start with short checks that each answer one operational question. Checking a rendered login page, a successful search and a cart update separately makes failures easier to diagnose than one long checkout script. Keep basic availability checks and focused API checks alongside browser journeys to help isolate failures.
Choose journeys by impact and operating risk
Use these five gates before automating an action:
| Selection factor | Question to resolve |
|---|---|
| Customer impact | Which essential task becomes unavailable when this step fails? |
| Dependency exposure | Does it exercise authentication, search, inventory or a payment dependency? Is automated access authorized? |
| Safe repeatability | Can repeated runs and retries avoid charges, duplicate records or excessive load? |
| Account permissions | Can a dedicated account perform the task without administrative access or customer-data visibility? |
| Cleanup effort | Can every created record be identified, removed safely and checked afterward? |
Prioritize high-impact paths with controlled side effects. Where appropriate, check that valid input succeeds and invalid input is rejected. Keep negative cases harmless: repeated authentication failures can trigger account lockouts or security responses.
Design a bounded login-to-payment journey
The following proposes an implementation. It makes no capability claim about any named product:
- Start the login check with an isolated browser session and a dedicated test account. Submit credentials, then wait for an authenticated identity marker and usable navigation. A redirect alone does not prove successful authentication. Keep any invalid-input check separate.
- Search for a maintained test catalogue item. Wait until loading finishes and the expected item appears. Verify its identifier; a non-empty results list alone is insufficient. This exercises the browser interface and its search dependency.
- Add the designated item to the test account’s cart. Check the item identity and quantity. Design writes to be idempotent, using a per-run operation key where the application supports one, so retries cannot duplicate the intended change.
- Continue to payment only through an explicitly approved sandbox route with test payment credentials. Confirm the sandbox outcome and label it accordingly. Validation covers only that route; production settlement remains untested. Remove test-owned cart or order state through an authorized cleanup mechanism, then verify removal.
Make each stage independently diagnosable before combining them. Existing end-to-end tests can supply useful code, but review their credentials, fixtures and side effects before scheduling them against production.
Control maintenance, secrets and synthetic data
Use stable selectors, such as maintained test identifiers or accessible roles with unambiguous names. Avoid positional selectors and generated CSS classes. Wait for explicit readiness conditions, such as an enabled submit control or completed results panel. Avoid fixed sleeps.
Long flows accumulate stateful dependencies. Expired sessions, changed inventory and leftover carts can break later steps without an application outage. Unstable selectors add maintenance whenever presentation changes.
Give credentials only the permissions needed for the journey. Redact secrets from logs, screenshots and failure artifacts. Use recognizable test-data prefixes and run identifiers. Cleanup must execute after failures too. Report and investigate cleanup failures so records do not silently accumulate.
Exclude destructive actions, actual charges, unsolicited messages, CAPTCHA bypass and broad changes to production records unless a separately authorized safe mechanism exists.
Tag synthetic traffic in observability data and arrange analytics exclusions with product teams. Repeated searches, carts and sandbox conversions can inflate funnels and contaminate experiments. A test account still needs explicit exclusion.
Separate rendered-page checks from scripted transactions
24Observe is built by the Networkers Home group, so weigh our view accordingly. Its current browser-check implementation uses headless Chromium to execute JavaScript and inspect rendered content. The 24Observe browser-monitor documentation describes optional contains and not_contains assertions on that rendered DOM.
The scripted login-to-payment design above requires multistep interactions. Playwright-based transaction journeys remain planned in the supplied roadmap material. Treat the design above as a proposed workflow, not as confirmation of current product support for those interactions.
How should you choose check locations, intervals and noise controls?
Select probe locations based on the customer access paths you need to test. Can customers reach the service through their usual dependencies? Coverage across several regions does not, by itself, answer that question.
Match locations to customer paths and network exposure
Begin with how customers connect: their countries and major markets, business-critical accounts, and regional traffic peaks. Map the infrastructure exposed along those routes. An internal administrative service needs different vantage points from a public storefront or partner API.
Decide which dependencies each check must pass through: public DNS, internet routing, CDN, WAF, load balancer, identity provider and application backend. Verify that its execution follows the path you intended.
| Execution point | Question it answers | Important limitation |
|---|---|---|
| Public probe outside your network | Can an external client complete this request through the public entry point? | Its provider and network path cannot represent every customer connection. |
| Private runner inside the application network | Can this service respond through the internal path? | It may bypass public DNS, edge controls and internet connectivity. |
| Private runner in a branch or partner network | Can users on this access path reach the service? | Its result applies to that path, not every location. |
When an internal check succeeds and an external check fails, the difference helps narrow the investigation. Internal success cannot establish availability for customers. Keep self-managed probe infrastructure separate from the application to reduce the chance that one failure disables both.
Investigate failures affecting a single region. Check probe health alongside routing, DNS responses and edge behavior. The number of affected locations alone cannot justify declaring a global outage or dismissing the failure as noise.
24Observe comes from our Networkers Home group, so account for that relationship when weighing our view. The API reference describes optional execution across multiple regions for HTTP/HTTPS checks. Verify the enabled regions and your check’s eligibility. That statement does not cover browser checks or other check types.
Publication verification is required because the supplied material gives conflicting accounts of regional coverage. The API documentation describes support for multiple regions; the about page says operation is limited to a single region. Confirm the current coverage and resolve this discrepancy before publishing.
Set cadence against risk and execution cost
Shorten intervals when missing a failure would materially affect operations. Expensive journeys can run less often if a simpler availability check covers the time between them.
For a hypothetical calculation, scheduling one check at 60-second intervals across two locations gives 1,440 × 2 = 2,880 scheduled executions per day before retries. The total represents executions rather than billable units. Check how each vendor bills retries and multistep journeys separately, using the relevant plan details.
Base timeouts on measured healthy execution times and how long the service can acceptably wait. Set them too low and normal variation becomes a failure. Set them too high and hung runs occupy runner capacity longer.
Detection delay varies with the failure’s timing within the schedule, execution duration and result evaluation. Retries and requirements for consecutive failures increase that delay. A check interval cannot guarantee a detection time.
Control noise without concealing failures
Document why each control is needed and use them together:
- Require consecutive failures where transient errors are common. In 24Observe, this threshold is exposed, with a documented starting value of one failed result.
- Limit retries by both attempt count and total elapsed time. Keep the first failure and subsequent retry results so intermittent faults remain visible.
- Preserve evidence for each location when regional evaluation requires wider confirmation. Use the check-history workflow to compare individual failures.
- Give maintenance a defined scope, an owner and an expiry. Check whether it pauses execution or only notifications. According to 24Observe’s release notes, alert suppression leaves checks running.
- Monitor probe health independently, including missed executions, scheduler lag, runner capacity, connectivity and expired test credentials. Treat missing results as missing evidence, never as successful checks.
When reviewing actual incidents and alert-fatigue patterns, check whether these settings reduced noise while retaining evidence of failures that affected customers.
Which status, content, timing and certificate assertions matter?
An assertion states the conditions a check must satisfy to pass. Useful website uptime checks establish whether an endpoint supports the intended task. That means checking its response and content, measuring duration, and verifying TLS identity.
Expect the right status and redirect destination
Choose status codes according to the endpoint’s contract. A read operation may require 200, while creating a resource may require 201. Deliberately invalid requests should receive the expected rejection: 400 for malformed input, for example, or 401 when authentication is missing. Unexpected success can reveal a validation or access-control failure.
For redirects, define both the destination and the final response. If a protected dashboard sends the check to a login page, that page’s 200 response does not prove the authenticated dashboard works. Verify the intended host and path. Reject redirect loops and unexpected destinations.
24Observe is built by our group, Networkers Home, so weigh our view accordingly. Its HTTP checks support assertions for status, response time and redirects. The endpoint-check documentation explains where to start. Browser monitors also support an optional expectedStatusCode assertion on the document response.
Verify content and business meaning
A 200 response can contain a maintenance page, an empty application shell or an error message. Check for a stable marker tied to the task. Navigation text that appears throughout the site provides little evidence that the task succeeded.
For APIs, keyword matching and response-structure validation answer different questions. An identifier in the response body does not prove the body is valid JSON, required fields use the expected types, or the object belongs to the test account. If your runner supports structured assertions, check those properties before evaluating business meaning. A stock lookup should return the expected test product and availability; a calculation should return the expected currency and amount.
24Observe checks HTTP responses and keywords at the byte level, without running page JavaScript. Its content-check overview covers matching expected text, such as product names or JSON fields. Matching a keyword alone does not validate a schema.
The browser assertions inspect the rendered DOM after headless Chromium executes JavaScript. Optional contains and not_contains checks can detect missing application text when JavaScript bundles break or data requests fail, including cases where the document returns 200. Select text that confirms the intended result appeared.
Separate request, render and transaction timing
An HTTP exchange has a request duration. Browser rendering also involves the client-side work required to display the page. Transaction duration runs from the task’s first action through to its verified result. A dashboard or checkout can remain slow despite a fast HTML response.
Base thresholds on observed task behavior under consistent test conditions and on operational requirements. Use historical results to account for normal variation. An interactive report and a lightweight health endpoint need targets suited to their different workloads.
24Observe describes slow-response classification for HTTP checks. In browser checks, timeoutMs limits page loading; a check fails when loading exceeds that limit. The separate degradedResponseTimeMs setting can mark a successful page as degraded if rendering takes too long. One setting identifies failure to finish, while the other identifies completion after an unacceptable delay.
Browser targets require a complete HTTPS URL. The monitors prohibit private-network destinations, loopback hosts and cloud-metadata endpoints, which rules out using them as internal-only probes.
Check certificate validity, expiry and identity
Evaluate TLS requirements separately. The certificate chain must be trusted, the certificate must fall within its validity period, and its hostname must match the intended endpoint. Schedule expiry warnings early enough to allow renewal, deployment and verification.
These criteria provide a basis for evaluation; individual vendors may cover different requirements. 24Observe documents certificate-expiration tracking with advance alerts. The guide to why TLS monitoring matters can help when defining certificate checks, particularly when redirects add HTTPS hosts to the request path.
How should synthetic alerts open, escalate and auto-resolve?
A synthetic alert should start a response process with clear ownership and an explicit recovery condition. Define that process before enabling paging. Evaluation policies vary by platform, so distinguish between a failed execution, a failed monitor evaluation and an opened incident.
Define the operational state sequence
| State | Operational meaning and required action |
|---|---|
| Healthy | The check satisfies its assertions. Keep the result as a baseline for comparison. |
| Failed evaluation | An assertion fails. Preserve the result and evaluate the incident-opening policy. |
| Incident opened | The failure meets that policy. Notify the responsible team with evidence and response instructions. |
| Acknowledged | A responder accepts ownership. Acknowledgment does not establish service recovery. |
| Observed recovery | Subsequent checks satisfy the recovery policy. Record recovery, resolve the eligible incident and notify responders. |
Set an acknowledgment deadline and name a backup owner. If nobody acknowledges within the agreed window, escalate to the next responder. Schedule a timed review for acknowledged incidents that remain unresolved, so acknowledgment does not leave them unattended. Document both paths in your on-call procedures.
Every actionable notification must include:
- The failed assertion, with expected and observed results.
- The affected journey and failing step.
- The probe location.
- The first observed failure, including its timezone.
- Evidence, such as the response, error details or relevant execution output.
- The owning team or responder.
- A runbook link with safe verification and mitigation steps.
Preserve the original failure time during escalation so responders can distinguish outage onset from notification time.
Choose opening and recovery policies deliberately
Requiring consecutive failures can suppress isolated network glitches, but it also delays incident opening. Recovery confirmation involves a similar trade-off. Accepting the next passing execution closes the incident sooner; requiring sustained success can reduce repeated opening and closing.
Base these policies on journey criticality, check frequency and tolerated detection delay. Check which controls your platform supports before defining the policy. If probes are unreliable, investigate them before raising thresholds. Use the alert-fatigue guidance to review whether each page warrants action.
Apply the lifecycle precisely in 24Observe
24Observe is built by our group, so weigh our view accordingly. Its monitor-triggered incidents resolve automatically when the triggering failure clears. Browser-monitor incidents follow the same lifecycle, with alert channels governed by the same alertThreshold rules.
The monitor API documentation specifies a configurable consecutive-failure count for incident opening; the default is one. Incident emails provide actions to acknowledge and resolve an incident. Through PagerDuty Events API v2, 24Observe automatically sends a resolve event after the monitor recovers.
Connected status pages update automatically when incidents open and resolve. During an incident, affected components appear as degraded or down. Log-alert incidents require operator closure, so account for the incident category when planning automatic resolution.
Use Recent checks on the monitor detail page to compare errors and response codes, following the response runbook. A passing check confirms current recovery for the tested path. Responders still need to establish the cause and whether recurrence has been prevented.
Drill notification and recovery delivery
Send a monitor test alert to every configured destination through the test-alert workflow. Confirm receipt and check that the notification provides ownership and evidence. Verify acknowledgment as well.
Then cause a controlled failure on a safe test target and exercise escalation. Restore the target, confirm that the incident resolves, and check delivery of the PagerDuty recovery event and the status-page update. Record any missing notifications or unexpected delays, along with incorrect component mappings, as follow-up work.
How do you run synthetic checks in CI and after deployments?
Treat a release gate and an always-on monitor as separate controls. A gate decides whether a particular build can proceed. Scheduled monitoring checks whether the deployed service continues working as traffic, dependencies and infrastructure change.
Follow a repeatable release workflow
-
Reuse stable assertions and helpers from existing integration or end-to-end tests, keeping environment-specific setup separate. Run tests that reset a database only in isolated environments. They are unsuitable for production probes.
-
Supply the base URL, credentials, test-account identifiers and expected configuration through environment-specific settings. Keep secrets outside the repository. Ensure an API check cannot accidentally target production with destructive test data.
-
Keep the release set small and deterministic. Check essential paths such as authentication, a representative read request and critical page content. Gate only on checks with clear ownership, understood failure modes and stable assertions. Investigate unreliable external dependencies and flaky selectors before allowing them to become unexplained release blockers. Document any non-blocking checks and who has authority to override them.
-
After deployment, smoke-test production safely. Verify the deployed endpoint and, where appropriate, rendered page content. Use dedicated test accounts, synthetic records and narrowly scoped credentials. Production shares databases, billing, notifications and analytics with customers, unlike isolated environments. Prefer read-only actions. Where writes are necessary, control them, suppress unintended messages, mark synthetic activity and clean up safely.
-
Keep recurring availability checks running after deployment, because passing a release gate does not establish that the service will remain healthy.
Match the integration to your platform
- 24Observe is built by our group, so weigh our view accordingly. We list it first for its code-managed provisioning workflow. Teams can create and update monitors through code during deployment, using appropriately scoped tokens. Consult the monitor-management API documentation. A self-hosting path is also documented. This suits teams managing monitoring configuration alongside releases. These capabilities do not establish a native release-gating feature.
- Checkly suits repository-driven testing:
checkly testtargets different environments, whilecheckly deploypublishes persistent monitors. It supports release gating and execution from global or internal locations. - New Relic supports CI/CD integration and scheduled post-production checks, with public and private testing locations. It suits teams connecting build-time testing with ongoing synthetic monitoring.
- Dynatrace Synthetic Monitoring Classic supports pipeline-triggered, on-demand executions and public or private probe locations. It suits teams adding release checks to their Dynatrace workflow.
Keep evidence attached to the release
Record the commit, build identifier, environment, check revision and execution time with each result. Preserve failed assertions, response details, available screenshots and relevant logs, with secrets and personal data redacted. Retain the original failure when retrying; a later pass should not erase it. Link deployment records to check-result evidence so responders can distinguish an application regression from a probe failure.
Which synthetic monitoring tools fit your team?
Build your shortlist around who maintains the checks, where they must run and how failures reach the people responsible for recovery. A repository-managed browser journey serves a different operating model from an availability check connected to an incident and customer update. Assess private test execution separately from platform self-hosting: evidence for one does not establish the other.
24Observe
24Observe is built by the Networkers Home group, so weigh our view accordingly. We list it first because monitoring, incident handling and status-page updates share an operational workflow. That ordering reflects workflow fit, with no claim of overall superiority.
Its availability monitoring covers HTTP, TCP, SSL/TLS, ping, port and keyword checks. HTTP checks inspect endpoint responses; keyword checks validate expected content. With heartbeat monitoring, scheduled jobs report successful completion. This is useful for a backup or batch process whose failure may leave the website available.
The documented rendered-browser monitors load pages in headless Chromium, execute JavaScript and inspect the resulting DOM. These checks can validate content generated by a client-side application, where a successful HTTP response alone may be insufficient. Browser failures follow the same incident lifecycle as other monitors, including automatic closure after recovery.
Monitoring and security signals share storage and incident records. Both incident handling and status pages sit within the platform, with incident activity feeding public or private status pages. NOC, SOC and SRE teams evaluating a shared workflow for these signals have a concrete reason to consider it.
Keep the browser scope precise: scripted transaction journeys remain planned functionality. The published roadmap describes that intended expansion. Current rendered-page checks do not establish support for arbitrary multistep journeys.
The 24Observe self-hosting documentation provides a deployment path. Before choosing a deployment, verify browser-runner availability and supported execution regions. The monitor API documentation describes regional options for HTTP/HTTPS; support for other check types needs separate confirmation. Documented browser restrictions exclude private, loopback and cloud-metadata targets. Confirm deployment-specific availability and current plan details before committing.
Checkly
Checkly is worth evaluating when developers want monitoring definitions reviewed and maintained alongside application code. Its documentation describes TypeScript-defined resources and Browser Checks that schedule Playwright specifications held in a repository.
Teams already maintaining Playwright tests have a clear starting point for evaluation. Checks, groups, notification channels and status pages can be represented as repository resources, while UI-based creation remains available. The documented commands distinguish testing against an environment from deploying ongoing monitors.
Checks can run from globally distributed locations or through the Checkly Agent installed on infrastructure you manage. The agent supports execution against internal services, staging systems and private APIs. This provides private execution; the evidence does not establish self-hosting for the full platform.
Checkly also documents multistep API checks and release-gating integrations. Its fit is clearest where engineering teams expect to maintain test code and monitoring changes through their development workflow.
Datadog Synthetics
Datadog Synthetics belongs on the shortlist when API, browser and mobile testing all matter to the evaluation. Its synthetics documentation introduces each category and covers private locations and Continuous Testing.
That documented range gives teams assessing mobile application tests alongside website journeys a reason to investigate further. A browser-only comparison would leave part of that evaluation unanswered.
Private locations are documented. The supplied evidence does not establish control-plane hosting details, so confirm those separately. Map each required test category to its runtime and deployment requirements during evaluation. API, browser and mobile tests need individual checks rather than an assumption that they behave identically.
New Relic Synthetics
New Relic Synthetics is relevant when cross-device journeys and dependency context are central requirements. Its product documentation describes simulated journeys across devices, browser configurations and operating systems throughout the application lifecycle.
The documentation also describes an entity map and visibility into dependencies associated with a synthetic test. An SRE investigating a failed journey can assess whether that context helps connect the failed interaction to affected services.
Lifecycle coverage includes build-pipeline integration and recurring production checks. Documented public and private test locations give teams a basis for evaluating external and internal execution needs.
Platform hosting remains a separate verification item. Public and private execution options do not establish how the platform itself is hosted, which matters when procurement requirements extend beyond privately operated test execution.
Grafana Synthetic Monitoring
Grafana Synthetic Monitoring runs within Grafana Cloud. Its documentation describes internationally distributed probes, scripted checks and browser checks.
Consider it when your team wants to manage this testing workflow in Grafana Cloud. A scripted or browser execution can contain several requests or interactions, and results can be examined from an overview down to an individual execution. The documented REST API supports programmatic check management.
The deployment boundary is explicit: the evidence covers a Grafana Cloud offering. Equivalent availability in a self-managed Grafana installation needs separate verification. Teams already choosing Grafana Cloud should assess whether the documented check types and execution model cover the journeys they will maintain.
Catchpoint
The supplied evidence is insufficient to recommend a best fit or describe deployment options for Catchpoint. A cited address uses the Catchpoint domain, but its accompanying capability statements identify LogicMonitor.
Those statements cannot support a Catchpoint capability profile. Before assessing its fit, verify current Catchpoint-specific documentation covering test categories and execution locations, including private runners and platform hosting.
Dynatrace
This profile applies specifically to Dynatrace Synthetic Monitoring Classic. Its documentation covers browser monitoring for individual URLs, recorded browser clickpaths and HTTP checks.
That scope is relevant when your requirements include recorded interactions and HTTP testing. Classic also supports on-demand executions associated with CI/CD, giving teams a documented basis for evaluating lifecycle testing.
Checks can run from public locations or private locations operated within an organization’s infrastructure. The documentation also covers container-based private execution on Kubernetes with autoscaling support.
These deployment details concern test execution. Confirm the applicable product version and private-location requirements before designing around them. The Classic documentation does not establish identical capabilities across every Dynatrace offering.
Uptrends
The supplied evidence is insufficient to recommend a best fit or describe deployment options for Uptrends. A substantive capability profile requires further verification.
Request current product documentation covering supported tests and browser scripting, along with public and private execution options and platform-hosting boundaries. Keep its fit undecided until that evidence is available; assumptions or a price-based ranking would not resolve the missing information.
Synthetic monitoring tools comparison: what should you verify?
24Observe is built by our group, so weigh our view accordingly. We list it first because our editorial focus is checks connected to incident handling. We have not scored or ranked these tools.
| Tool | Strongest documented fit | Deployment or execution evidence | What to verify |
|---|---|---|---|
| 24Observe | Endpoint and rendered-page checks linked to incidents and status pages | Self-hosting guide; browser targets exclude private, loopback and cloud-metadata addresses | Enabled regions and check availability for your deployment; scripted journeys remain planned |
| Checkly | TypeScript-managed checks and repository-based Playwright tests for code-oriented teams | Global execution locations; an agent runs within your infrastructure | Test design, internal-runner maintenance and consumption model |
| Datadog Synthetics | Teams assessing API, browser and mobile testing needs | Documentation covers private execution locations | Hosting model, necessary assertions and release workflow |
| New Relic Synthetics | Device-aware journeys with visibility into dependencies | Public locations and private execution options | Hosting model, runtime requirements and usage-based billing units |
| Grafana Synthetic Monitoring | Scripted checks and browser tests for Grafana Cloud users | Grafana Cloud service using worldwide probes | Required locations, test design and account configuration |
| Catchpoint | Not established in supplied evidence | Not established in supplied evidence | Obtain current product documentation before assessment |
| Dynatrace Synthetic Monitoring Classic | Browser clickpaths alongside HTTP monitoring | Public locations; private runners with Kubernetes deployment options | Product edition, runner prerequisites and action/request consumption |
| Uptrends | Not established in supplied evidence | Not established in supplied evidence | Obtain current product documentation before assessment |
Proof-of-fit checklist
Treat missing evidence as a research gap and reserve judgment on the product while you work through these checks.
- Run the same representative workflow against each candidate, using explicit pass criteria and safe test data.
- Induce a controlled failure. Confirm that the results explain which assertion failed and where.
- Validate DNS, proxies, firewall paths and target restrictions from the actual execution location.
- Inspect how credentials are handled, including secret storage, rotation, permissions and redaction in captured results.
- Restore service and verify incident closure, paging resolution and status updates. For 24Observe, inspect the documented event subscriptions.
- Assign ownership for selectors, assertions, runner health and runtime upgrades.
- Model execution consumption across scheduled runs, locations, retries and release-triggered tests using each vendor’s documented billing units.
How do you roll out synthetic monitoring without adding alert noise?
Use evidence-based exit criteria to determine the rollout schedule. Evaluate one monitoring surface alongside your current setup before replacing anything. 24Observe, built by our group, supports parallel evaluation, so weigh our view accordingly. For implementation, start with the quickstart.
Stage the rollout with explicit exit criteria
-
Inventory customer-critical paths and assign owners. Map each journey to its service owner and response team. Every production check needs a documented purpose, credentials owner, data-cleanup policy, threshold rationale and runbook. For unauthenticated or read-only checks, record why credentials or cleanup are unnecessary. This stage is complete when owners approve the inventory and every proposed check has a complete record.
-
Establish simple endpoint checks. Begin with response correctness and latency, sending results into the existing monitoring workflow. Observe normal variation before enabling paging. Move on when checks distinguish expected responses from controlled failures and owners can justify intervals, timeouts and failure thresholds from observed behaviour.
-
Add rendered-browser assertions selectively. Cover failures that response checks miss, such as absent client-rendered content. 24Observe’s browser checks evaluate content after JavaScript executes. Before proceeding, confirm that each browser assertion detects a documented coverage gap and survives expected interface changes.
-
Introduce safe transactions only where supported. Confirm the selected tool supports the required interactions. Use dedicated test identities, synthetic records and verified cleanup. Prevent downstream side effects and sensitive-data exposure. Scripted transaction journeys remain on 24Observe’s roadmap. Proceed once permissions, side effects, cleanup and evidence handling pass review.
-
Exercise the response lifecycle. Use a controlled test target or an approved fault exercise. Never cause an unplanned production outage. Verify paging, escalation, maintenance suppression, recovery notifications and status communication. 24Observe provides monitor test alerts; its maintenance windows suppress alerts while checks continue. Validate customer-facing changes through the status-page workflow. Complete this stage only after responders confirm delivery, suppression, resumption and closure.
24Observe synthetic tests can create real incidents and consume usage. Review the test guide before exercising failures.
Monitor probe health separately from application health. For self-managed probes, isolate their execution environment from the product and assign runtime-maintenance ownership. Record false positives, missed incidents, maintenance work and recovery-notification failures for operational review.
Production review checklist
- Confirm every check’s purpose, owners, cleanup policy, threshold reasoning and response runbook remain current.
- Review probe failures separately from service failures, and assign corrective work from the operational review.
- Retire overlapping checks only after the parallel evaluation demonstrates coverage and the response lifecycle passes its exit criteria.
Frequently asked questions about synthetic monitoring
What is synthetic monitoring actually testing?
Synthetic monitoring sends controlled requests or simulates actions to check whether a service behaves as expected. It usually examines externally visible behaviour, making it a form of black-box testing. Uptime checks establish availability; API checks and transaction tests examine functionality. Assertions should confirm that valid inputs succeed and invalid inputs receive the intended errors. Receiving a response alone should not count as success.
Does synthetic monitoring replace real user monitoring?
No. Synthetic probes exercise predefined paths, while real user monitoring observes actual sessions under varied conditions. A passing probe cannot establish that every customer journey works. Real-user data may reveal nothing about an unavailable path that nobody has visited. Use synthetic checks for repeatable coverage and real-user monitoring to understand experiences beyond those controlled scenarios.
How do heartbeat monitors differ from active probes?
An active probe initiates a request to the target. An inverted heartbeat waits for a job to report successful completion. 24Observe is built by our group, so weigh our view accordingly. Its documentation describes this heartbeat pattern: an incident opens after the interval and grace allowance expire, then resolves when another heartbeat arrives. Adjust the grace setting to allow for normal scheduling variation.
Why can HTTP 200 still hide a broken page?
A successful server response can still leave the interface broken. Raw-response checks can pass while JavaScript fails or expected content never appears. A browser check executes JavaScript and examines the resulting DOM. Assert on meaningful rendered text so that missing application content causes failure. This catches cases where a broken bundle or failed data request leaves the initial response unchanged.
How often should synthetic checks run?
Choose frequency based on the detection delay your service can tolerate, then account for execution cost, endpoint load and probe reliability. Run critical availability checks often enough to support your response objectives; schedule heavier journeys according to their operational value. Manage alert noise with appropriate confirmation rules and maintenance handling. Simply reducing every check’s frequency can delay detection.
Can synthetic monitoring run in CI/CD pipelines?
Yes. Existing integration or end-to-end test code can become synthetic probes, provided it is safe to execute in production. Keep provisioning separate from release gating: 24Observe supports managing monitors through code, including deployment-pipeline provisioning. Provisioning alone does not establish a gate. Release gating requires executing checks against the intended environment, evaluating their results and deciding whether the deployment should proceed.
Are browser checks the same as scripted transactions?
No. A browser check may load one URL and validate its rendered content; a scripted transaction performs a sequence of interactions and assertions. 24Observe’s current browser capability uses headless Chromium and checks the rendered DOM. Its roadmap lists Playwright-driven transaction scripts as planned. Current page checks should therefore not be assumed to support arbitrary login, cart or checkout workflows.
Frequently asked questions
What is the difference between synthetic monitoring and uptime monitoring?
Uptime monitoring usually asks whether a target responds or remains reachable. Synthetic monitoring can also exercise a known request, rendered page or customer journey and verify its result. A successful response alone may miss a broken login form or missing account data. Choose the simplest check that proves the behavior you care about, then add deeper checks where reachability is insufficient.
Can synthetic monitoring replace real user monitoring?
No. Synthetic monitoring verifies scenarios you deliberately select, while real user monitoring observes actual sessions. Predictable probes help detect failures even when nobody visits the affected path, but they cannot represent every device, network condition or user action. Use synthetic checks for repeatable coverage of important paths and real user monitoring to understand the experiences those checks do not reproduce.
Can a synthetic check fail when a website returns HTTP 200?
Yes. A successful HTTP response does not establish that the expected content or customer task works. A response assertion can check for required content, while a browser check can examine the page after JavaScript runs. For example, 24Observe distinguishes raw-response HTTP checks from rendered-browser assertions, which can reveal missing client-rendered content even when the initial server response succeeds.
How often should synthetic monitoring checks run?
Choose the interval from the importance of the path, acceptable detection delay, execution cost and impact on production. Shorter intervals create more executions, and additional locations increase that volume. Consider timeouts, retries and failure thresholds together rather than adjusting frequency alone. Also monitor probe health, because an unhealthy runner can create misleading failures or leave a gap in coverage.
Is heartbeat monitoring a synthetic check?
Heartbeat monitoring is better understood as an inverted check: a job reports successful completion instead of a probe actively requesting a response. Teams often manage it alongside synthetic and uptime checks. In 24Observe, a missing success ping beyond the configured interval and grace period opens an incident, and the next heartbeat resolves it. This confirms reported completion, not necessarily the correctness of every output.
Can synthetic checks run in CI/CD pipelines?
Yes, where the selected tool supports that workflow. New Relic documents CI/CD integration, Checkly supports testing against environments and deploying persistent monitors, and Dynatrace Synthetic Monitoring Classic supports on-demand CI/CD executions. Keep release gates focused on dependable checks with clear ownership. For 24Observe, the supplied facts support provisioning monitors through code, which should not be confused with a documented native release gate.
Does 24Observe support scripted multi-step browser transactions?
The supplied documentation establishes current browser monitors that load URLs in headless Chromium, execute JavaScript and inspect the rendered page. It separately identifies Playwright-driven scripted transaction journeys as planned. Do not treat a rendered-page content check as proof of arbitrary login, checkout or other multi-step scripting support. Verify current documentation before selecting it for a workflow that requires those capabilities.