AIOps · 24Observe
AIOps, AI SRE and Root Cause Analysis Tools: A Practical Guide
Swipe sideways to see the whole diagram.
What is AIOps, and what does the term actually mean?
AIOps means artificial intelligence for IT operations. It applies AI, machine learning and analytical methods to operational data so teams can detect unusual behaviour, connect related events, investigate faults and, where configured, automate responses. When evaluating these tools, start with the operational task you need help with. Collecting more data, recognising a fault, explaining its cause and authorising a production change are different requirements.
The concept builds on using analytics and machine learning to examine monitoring records and event streams. An AIOps workflow looks for relationships across signals rather than examining each alert separately. Data aggregation, AI-based analysis and automation form its foundations. A product’s support for those capabilities, however, tells you little about how thoroughly it investigates an incident. An anomaly identifies unusual behaviour; establishing its cause requires further investigation.
Our perspective comes from Networkers Home, a security training institute founded in 2007 by Vikas Swami. That experience shapes the questions we ask. Product testing is still necessary to answer them. 24Observe is built by the Networkers Home group, so weigh our view accordingly. We will distinguish documented capabilities from the checks you should perform in your own environment.
Four operational jobs that should stay distinct
We will use a hypothetical incident throughout this guide: a checkout application becomes slow, followed by alerts for API timeouts, worker queue growth and failed browser checks. These symptoms might share an upstream dependency, or they might represent separate faults. A recent database configuration change gives engineers one hypothesis to test; its role in the slowdown remains unproven. The scenario is illustrative and does not describe a customer incident.
| Job | What it means in this incident |
|---|---|
| Collect telemetry | Gather application logs and performance metrics. Having records available does not explain the slowdown. |
| Detect a problem | Recognise unusual latency or a metric threshold breach. This establishes a symptom that needs attention. |
| Investigate the cause | Examine dependency context and test explanations against available records. An AI investigation should give engineers evidence to inspect. |
| Change the system | Roll back a configuration or take another corrective step. Response workflows need explicit permissions, approval boundaries and records of what happened. |
Monitoring can tell the on-call engineer that checkout latency has breached a threshold. Investigation asks which dependency, event or change explains it, then looks for evidence that might contradict that explanation. Keeping those jobs distinct helps engineers judge what a tool actually contributes. For related reading, see monitoring versus observability.
The following sections explain the work behind AIOps, compare tools using documented evidence and show how to introduce investigation assistance with controlled production access. The aim is to support a defensible choice for your team’s incident workflow. There is no universal winner across those requirements.
How does AIOps work? Six jobs for AI for IT operations
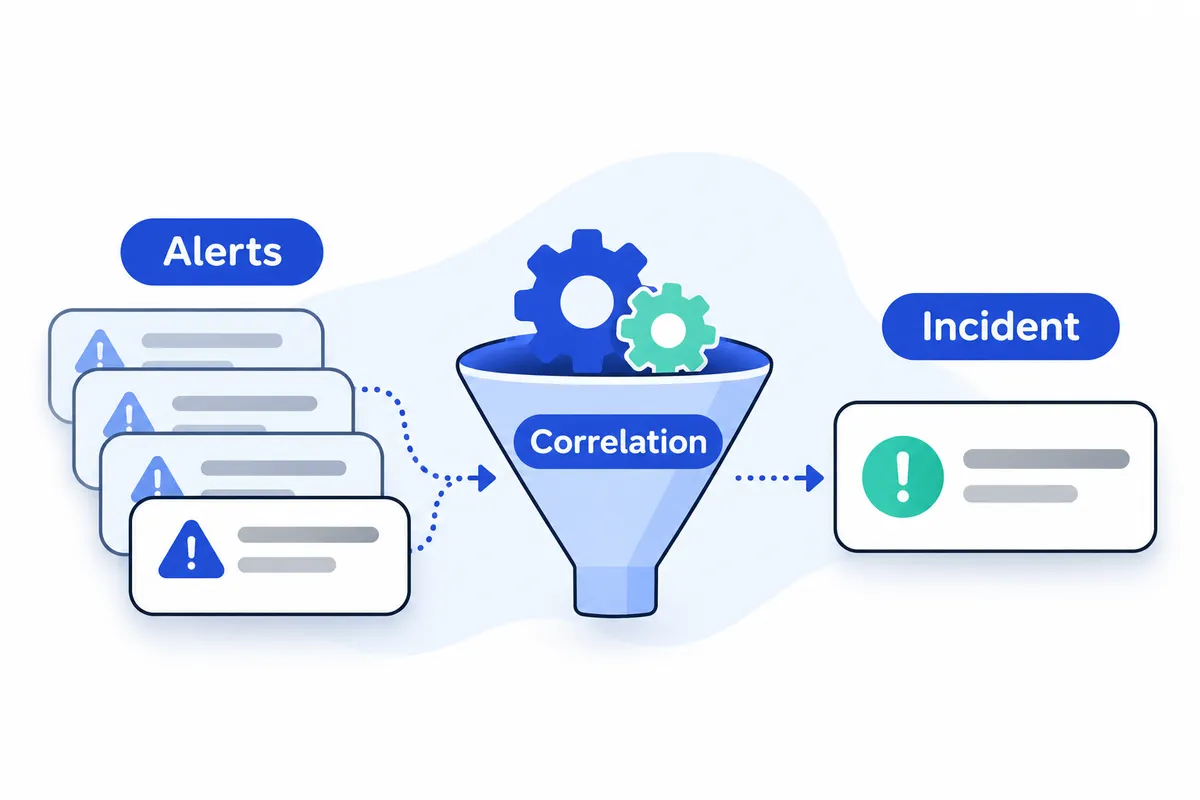
AIOps connects operational data to analysis and, where permitted, action. Use these six jobs to evaluate a platform, checking which ones it supports. We link to resources from 24Observe, built by our group, so weigh our view accordingly.
| Job | Input | Expected output | Engineer’s verification question |
|---|---|---|---|
| Collection and normalization | Telemetry from different systems | Records with consistent fields and identities | Do timestamps, units and service names align? |
| Noise reduction | Repeated or redundant alerts | Fewer duplicate notifications | Can I still inspect every original alert? |
| Event correlation | Separate symptoms and dependency information | Related symptoms grouped together | What evidence supports the relationship? |
| Anomaly detection | Current observations and historical patterns | Departures from expected behavior | Is the baseline appropriate for this workload? |
| Root-cause investigation | Correlated symptoms, changes and telemetry | A supported explanation and proposed response | What evidence could disprove this explanation? |
| Automation | Findings, policies and authorized workflows | Diagnostics, tickets or approved actions | What can execute, with whose permission? |
1. Collection and normalization
Each signal answers a different question. Logs record activity and errors. Infrastructure measurements track resource use and saturation, showing how performance changes over time. Events capture individual occurrences, such as configuration changes. Trace signals add observations about request paths and timing.
Useful observability depends on consistent timestamps, units and entity identifiers. Normalize these fields while retaining the original records. Inconsistent data can lead analysis to connect the wrong hosts or put events in the wrong order.
2. Noise reduction
Deduplication combines repeated alerts for the same condition, which can reduce alert fatigue. A lower notification count alone tells you nothing about the cause. Check that suppression still lets engineers see changes in severity and identify newly affected systems.
3. Event correlation
Correlation links separate symptoms, sometimes through a dependency they share. An API timeout differs from a database connection error, though a single failing database could explain both. Look for dependency context that supports the connection. Nearby timestamps alone are insufficient grounds for grouping symptoms.
4. Anomaly detection
An anomaly means observed behavior differs from what was expected. Establishing an outage or attack requires more evidence. Increased traffic may be legitimate demand; unusual CPU activity may come from scheduled work. Before escalating, account for seasonality and workload changes, then check the effect on users.
5. Root-cause investigation
Consider a hypothetical latency incident after a configuration change. API responses slow down while database waits rise and connection errors appear. A platform might group those symptoms and propose a shared cause for engineers to investigate.
An incorrect diagnosis of hostile traffic would leave the engineer with a single notification and the wrong explanation. Require investigation evidence that tests alternative explanations. Did traffic increase? Did degradation start after the change, and does the database evidence support the proposed cause? Use correlation to direct that investigation without treating the grouping itself as proof.
6. Automation
Where a platform supports them, response workflows can act on findings. Define permissions separately, keeping authority to restart services or block traffic distinct from permission to investigate:
- Recommendations: allow analysis and proposed next steps without executing them.
- Diagnostic execution: approve specific queries or scripts within a bounded scope, and record their results.
- Ticket creation: permit operational records and routing independently of access to infrastructure.
- Production changes: require explicit authority and approval rules, with rollback planning and an audit trail.
Some platforms adapt based on operational responses they observe, including successful actions and engineers’ preferred responses. Ask exactly what that feedback changes and how engineers can review those changes. Neither continuous learning nor automatic improvement is guaranteed across platforms.
What is an AI SRE, and how does it differ from AIOps?
An AI SRE is a working label for an agent that investigates reliability incidents. Here, we use the term to describe the work, while keeping the engineer accountable for production. A useful investigation should collect observations, test possible explanations against telemetry and explain its conclusions using records an engineer can inspect.
Classic, event-oriented AIOps emphasizes anomaly detection, event correlation and response coordination. An investigation agent makes the inquiry more explicit: it retrieves evidence, evaluates a hypothesis and chooses what to examine next. The approaches differ in interaction and workflow, with substantial overlap. AIOps already includes causal investigation and automation, including diagnostic scripts and incident routing.
| Dimension | Classic event-oriented AIOps | AI SRE investigation agent |
|---|---|---|
| Starting signal | An anomaly, event stream or alert cluster | An incident, alert or engineer’s question |
| Investigation process | Correlation and configured analytics; may include causal analysis | Iterative evidence gathering and checks of competing explanations |
| Output to evaluate | Grouped events, diagnosis, recommendations or configured responses | Check whether conclusions have supporting records, acknowledge uncertainty and offer useful next steps |
| Permission boundary | Access and automated actions depend on configuration | Tool permissions should separate investigation from production changes |
| Human responsibility | Own policies, validate findings and govern automation | Review evidence, challenge conclusions and authorize consequential actions |
Investigation requires more than an alert summary
A chat interface that paraphrases “latency increased” has reformatted a symptom. An investigation should establish which services are affected and examine relevant observations, explaining why one cause fits better than alternatives. A natural-language interface alone provides no evidence that this investigation took place.
For a concrete example, consider 24Observe’s AI analyst, built by our group, so weigh our view accordingly. It uses read-only investigation tools to investigate, follows dependency relationships and returns a verdict containing cause, impact and linked evidence. Its multistep security triage also reports confidence and suggested actions. These are specific capabilities to evaluate in this product, rather than assumed characteristics of every AI SRE tool. Each conclusion still needs scrutiny.
Where the AI SOC analyst overlaps
An AI SOC analyst examines potentially malicious activity and containment needs. The reliability question is usually, “What interrupted service, and how can we restore it?” The security question adds, “Was this hostile, what was touched, and what should we contain?”
The workflows can draw on overlapping telemetry. A traffic surge might require reliability investigation and security triage. An outage and an attack can coexist, and incomplete evidence may leave that distinction unresolved.
Evaluate output quality and inspectability ahead of the vendor’s “agent” label. Check whether an engineer can follow the citations and identify unsupported assumptions in the investigation and response record. Without those checks, a plausible narrative is a weak basis for production decisions.
How does AI root cause analysis connect topology, changes and log patterns?
AI root cause analysis links an observed failure to a dependency and a possible trigger, then checks measurements that support or challenge that explanation. Choosing the first error in the timeline is no substitute for checking those connections.
Continue the hypothetical latency incident: checkout and order-history requests become slow while catalogue browsing remains healthy. Every service, change, log message and measurement below is illustrative. This is a hypothetical example, with no customer incident or measured product result behind it. Start by establishing which operations are affected, using API monitoring evidence alongside service telemetry. Avoid assuming the entire application is degraded.
Move from affected services to shared dependencies
Here, checkout and order history both reach a database through a connection proxy. Catalogue browsing uses a separate cache. The proxy and database are therefore plausible shared dependencies, though neither has been identified as faulty.
Keep the dependency direction clear. Checkout calls the proxy and depends on it. Engineers commonly describe the proxy as an upstream dependency, even though requests travel from checkout towards it. The investigation must preserve who calls whom. Two services sharing a host have a different relationship from one service waiting for another.
Entity identity needs the same care. The production “orders” service must remain distinct from its staging counterpart. Environment labels and stable resource identifiers, alongside names, help establish whether a log, deployment record and metric refer to the same component. Merge identities incorrectly and unrelated evidence can produce a convincing explanation.
A topology map represents component connections and may overlay health information. A context graph links those operational entities to supporting records, such as an observation establishing a dependency. Configuration changes and associated incidents can also supply context. See the context graph explanation from 24Observe, built by our group, so weigh our view accordingly. We will cover its product workflow in the comparison sections.
For each connection, ask: “What evidence establishes this relationship, and when was it observed?” The context documentation offers a concrete reference for attaching evidence and recency to relationships. An old connection could belong to a retired deployment. A recently observed relationship provides stronger evidence of the current request path, although missing telemetry can still leave gaps.
Trace data can help establish that one service called another; logs and inventory offer other clues. Receiving spans does not establish complete application tracing. Sampling or missing propagation can obscure parts of the path, as can services without instrumentation.
Treat preceding changes as hypotheses
Suppose a proxy configuration update occurred before the latency increase in our example. Its timing makes it a candidate explanation. The order of events alone cannot establish causation.
Inspect the change and ask how it could cause the observed failure. If the update lowered the number of permitted database connections, requests might have to wait for a connection to become available. That mechanism predicts longer connection-acquisition delays and growing queues, with more waiting on the affected paths.
The graph also helps estimate blast radius by identifying services that depend on the component and could suffer. Confirmed impact needs separate evidence. An idle reporting service, for example, could share the proxy without showing errors. Keep observed failures distinct from components that are merely at risk. Apply the same reasoning to network dependencies: a shared link indicates possible exposure; degradation still needs to be established.
Compare log patterns with independent measurements
Checkout might report database timeouts in this hypothetical incident, while order history reports exhausted retries. Different messages can reflect the same dependency failure. Log analysis should compare when messages appear and how often, checking component identity against normal operation. Counting matching words provides a weaker basis for investigation.
The proxy explanation gains support if connection-wait measurements increase after the update and active connections reach the new limit. Database execution times remaining close to their earlier levels would add independent evidence. Together, these observations connect the configuration change to a mechanism. Metric-alert context helps only when those measurements test the proposed explanation.
Evidence that contradicts the theory must affect the conclusion. Waits that began before the update would weaken the timing argument. If proxy queues remain healthy while database execution times rise, attention should shift towards the database. Where measurements are missing, record the uncertainty explicitly.
Keep open the possibility of two concurrent failures. Checkout might also report errors contacting an external payment service, while order history shows only database waits. Assigning both to one cause would conceal useful evidence. Correlation can reduce alert fatigue, but separate explanations must remain available when timing differs, dependency paths diverge or measurements point in different directions.
What should you demand from an AI incident investigation?
An AI-generated explanation should be a testable operational claim. Before procurement, ask the vendor to investigate an incident your engineers understand, then inspect the evidence and access controls. A plausible summary alone does not make a convincing demonstration.
Require evidence an engineer can inspect
Every investigation should let an engineer review:
- Source records, query results and citations supporting each material claim.
- The interval searched, its timezone and any comparison period.
- Identifiable services, hosts, users or network components, with evidence supporting their relationships.
- The proposed explanation, including what the system believes happened, the observations supporting it and what remains uncertain.
- A recommended diagnostic check or action, with its target and expected effect.
A citation must open the relevant observation. Linking to a dashboard without preserving the incident’s filters and time range leaves the engineer reconstructing the investigation.
24Observe is built by the Networkers Home group, so weigh our editorial view accordingly. Its AI Analyst investigates through read-only tools and removes sensitive material from evidence before model submission. Evaluate its documented response records against your own acceptance criteria: they capture the finding, supporting evidence, approval, action and eventual resolution.
Require a reviewable investigation record containing queries or tool requests, parameters, returned observations and the final decision summary. “Reasoning trace” should mean recorded investigation steps and an inspectable decision summary. Vendors should not promise access to a model’s private internal reasoning. The record needs enough operational evidence for an engineer to challenge the finding.
Separate investigation rights from execution rights
Read permission and change permission belong in separate procurement questions. An investigator that can inspect telemetry does not need credentials capable of restarting services, modifying firewall rules or changing infrastructure.
Review the context access documentation alongside the MCP access documentation as examples. 24Observe’s context tools are read-only, require context:read and derive organizational scope from the token. That does not establish that every external-agent interface is read-only: the agent permissions documentation also describes write-capable roles.
During adoption, require explicit human authorization before any production-changing action. Approval should identify the target, exact change, approving person and rollback procedure.
Keep that procurement requirement distinct from narrower vendor mechanisms. For example, 24Observe documents human authorization for sensitive response proposals in its agent cookbook. The analyst.enforcement_proposed event covers proposed enforcement, including IP blocking, without execution before approval. Neither statement alone proves that every possible production mutation uses that approval path.
Establish data handling before enabling an LLM
Require organization-level authorization for LLM use, with a named owner and a revocation process. 24Observe requires organizational opt-in and permits customers to supply their own model-provider key.
Supplying a key does not establish data residency or tell you where requests travel, which provider retains prompts or results, or whether processing stays local. Request a data-flow diagram and contractual answers covering endpoints, subprocessors, retention, deletion and training use.
Check redaction separately at collection, storage and model submission. The administration documentation describes 24Observe’s edge and ingestion redaction options, plus audit attribution identifying the actor, time, origin and whether a person or token acted. Test redaction with representative sensitive values rather than assuming every payload is covered.
Use pass/fail procurement questions
Require demonstrations or written evidence for these gates. Treat an unanswered question as a failed gate pending verification.
| Gate | Pass/fail question |
|---|---|
| Evidence | Can an engineer open supporting observations with the original time window and entity identifiers? |
| Record | Are investigation steps and the decision summary retained for review? |
| Access | Can investigation run without infrastructure-changing credentials? |
| Approval | Are production changes blocked until an authorized person approves the specific action? |
| LLM governance | Can the organization explicitly authorize and revoke model use? |
| Data handling | Are redaction points, destinations and provider retention documented? |
| Tenant boundaries | Do tests demonstrate that tokens cannot retrieve another organization’s records? |
| Auditability | Can reviewers attribute reads, proposals, approvals and executed changes to accountable identities? |
What are the risks and limits of AI incident investigation?
An AI investigator can build a convincing explanation from incomplete observations. Use its output as a working hypothesis, check it against production evidence and keep uncertainty visible.
Incomplete context can produce the wrong cause
Test the investigator against these failure modes:
- Missing database logs can make an application timeout appear to be an application defect.
- An outdated service map can point to a component that no longer serves traffic.
- Reused IP addresses, inconsistent hostnames or ambiguous service accounts can link unrelated events.
- Deployment churn and seasonal workloads can make normal behaviour look anomalous.
- A network interruption occurring alongside an authentication failure may require separate investigations.
- Treat the latest deployment as a candidate cause until the evidence establishes causation.
24Observe is built by the Networkers Home group, so weigh our view accordingly. Its graph relationships include confidence, recency and supporting evidence. Reviewers can use those attributes to assess a relationship, but they still need to establish whether it explains the incident.
Reducing notification noise can also hide separate incidents if alerts are grouped incorrectly. Keep the individual alerts accessible and check each symptom against the proposed cause.
Genuine citations do not establish causation
A genuine deployment record and a real error spike can still be connected by a false claim. Evidence links show where information came from. Reviewers must check the sequence of events and the proposed failure mechanism, then consider other explanations and observations that contradict the claim. Confident, fluent wording provides no substitute for that work.
An unresolved investigation and a false positive mean different things. A service failure may be real even when its cause remains unknown. A false positive occurs when a detection incorrectly signals the condition it is designed to identify.
If the observations cannot establish a cause, require an explicit conclusion such as: “The available observations do not establish the cause.” Record the evidence still needed and the next diagnostic step instead of forcing a verdict.
Operational content can expose or manipulate the investigator
Treat logs, tickets and tool responses as untrusted input. Text controlled by an attacker could tell the investigator to disregard evidence, retrieve secrets or misuse tools. Test these paths for prompt injection. 24Observe documents AI-agent security detections, including prompt injection, but detection cannot guarantee protection.
Logs may also carry credentials, personal information and customer payloads. Check which data reaches the model provider and review its retention terms. Verify that redaction handles the formats you actually use. 24Observe documents redaction before model processing and edge and ingestion redaction options. Test those controls with representative data.
Start with the security information when reviewing documented controls. That information alone does not establish certification or legal suitability.
Permissions, operating costs and remediation need owners
Excessive tool permissions can turn an incorrect inference into an operational risk. Use read-only investigation where possible, with narrowly scoped credentials. 24Observe documents token activity limits and human approval for sensitive responses. Check the permissions actually granted in your deployment.
Ask how model usage and repeated investigations affect costs, along with query consumption, exports, storage and ingestion. Check for query limits, throttling and delays in the pipeline. Make someone responsible for connector changes and entity mapping, as well as baseline tuning and regression testing.
Before remediation, name the owner, define validation criteria and prepare a reversal plan. Review the evidence together with response records and approvals before authorising changes in production.
Which AIOps tools should you compare for incident investigation?
24Observe is built by our group at Networkers Home, so weigh our view accordingly. This comparison distinguishes documented capabilities from points to verify in a demonstration. Review what the verdict contains, the evidence behind relationships, investigation permissions, deployment information and team fit. An unknown means the supplied material leaves the question unanswered. The capability may still exist.
24Observe appears first because its documented combination of cited verdicts, an investigation trace and contextual relationships matches this guide’s investigation criteria. The order does not reflect an independently measured ranking. Apply the same evidence checks to every tool before deciding which fits your team.
| Tool | Documented strength | Deployment information | Suitable team | Verification question |
|---|---|---|---|---|
| 24Observe | Cited root-cause findings, a reasoning trace and relationship context. Its AI analyst uses read-only investigation tools. | The supplied material does not establish the hosting model. | SOC, NOC and SRE teams evaluating operational and security investigations together. | Can an engineer inspect the reasoning trace and validate each cited finding? |
| NETSCOUT Omnis AI Insights | Adds network context to existing AIOps data through Omnis Sensor and Omnis Streamer. Integrations include Splunk, ServiceNow, Elastic ELK Stack and DataDog. | The supplied material does not establish the hosting model. | Network operations teams needing additional network evidence in existing workflows. | Which network evidence reaches your chosen integration, and how does it inform an investigation? |
| HPE Networking with AIOps | Network optimization and diagnosis across network, security and application issues. Can use Zoom and Teams data to investigate experience problems. | The supplied material does not establish the hosting model. | Network teams investigating user-experience degradation. | Can the demonstration connect application experience to the suspected network cause? |
| IBM Instana Observability | Live application-performance monitoring, with AI-assisted insights across the application stack. | Supports SaaS and self-hosting. | Application operations and SRE teams prioritizing application performance. | What evidence supports the suspected cause in your application stack? |
| IBM AIOps and IBM Consulting AIOps | IBM AIOps combines observability with operations for complex environments. Consulting applies generative AI to operational automation and business alignment. | The supplied material does not establish the hosting model for either offering. | Enterprise operations teams assessing platform and consulting requirements. | Which deliverables belong to the product, and which require a consulting engagement? |
| Azure Monitor | Built-in investigation capabilities; its Observability Agent correlates telemetry with resource context. | Log Analytics workspace and Azure portal workflows; optional custom ML pipelines need integration, such as Jupyter Notebook. | Teams using Azure Monitor workspaces for operational analysis. | Does your scenario use built-in investigation or require a custom pipeline? |
During a demonstration, ask to inspect incident records, response history and agent-access boundaries. These are concrete examples to examine, not features to assume every tool provides. For 24Observe, also confirm the organization-level LLM opt-in requirement and the option to bring your own LLM key. Its comparison collection is vendor-authored material and should be assessed on that basis rather than treated as independent validation.
How does 24Observe investigate reliability and security incidents?
24Observe is built by our group, so weigh our assessment accordingly. We give it the first detailed profile because its shared incident model addresses a practical NOC/SOC problem: investigating reliability failures and security signals within the same workflow.
Uptime and browser checks, logs, metrics, trace ingestion and security detection sit within one product. Monitoring, observability and SIEM use shared storage and a common incident model. Assess whether that combined evidence supports the analyst’s explanation. Having more telemetry on one screen does not, by itself, establish a cause.
From an opened incident to a supported verdict
LLM use requires opt-in at the organization level. Organizations may provide their own model-provider key. With that consent enabled, the documented investigation proceeds as follows:
- A failed monitor, breached metric threshold or matching detection opens an incident. Security detections enter the same incident pipeline as reliability signals.
- The analyst searches relevant logs, examines metrics, retrieves recent changes and follows graph relationships to identify potentially affected components. These investigation operations are read-only, as described in the AI analyst profile.
- It tests suspected causes against the available telemetry, dependencies and preceding changes. For security signals, corroborating evidence can include threat intelligence and independent indicators. The SIEM capabilities describe this evidence-checking role.
- The incident receives the analyst’s verdict, source citations, an investigation reasoning trace and a suggested next step. The concept documentation also describes how detections are classified as genuine or false positives.
Responders can inspect that explanation and check its supporting evidence. A root-cause verdict still needs validation against its citations, especially when telemetry is incomplete. During evaluation, check whether the cited records support the causal claim, then assess whether the proposed action follows from that evidence.
What the graph contributes
The context graph documentation describes services, hosts, identities, devices, assets, incidents, cases, changes, monitors, on-call people, AI agents and indicators of compromise. Relationships carry evidence references, with metadata recording confidence and recency.
An engineer should be able to inspect why two entities were connected. A relationship can point to the supporting log entry, trace, incident or audit record, providing a way to examine that connection.
The context engine runs periodically, deriving relationships from supplied telemetry and operational records. Ingested traces feed signals into the graph and support contextual investigation. Their role here is to provide evidence for incident analysis.
The product’s incident correlation can group incidents associated with a common cause into one case and send a single notification. This is useful when an upstream failure produces downstream symptoms. Correlation still needs review: check whether supported dependencies explain the grouping. Alerts occurring at the same time are insufficient evidence of a shared cause.
Investigation access is different from response authority
The built-in analyst reads evidence. Its investigation tools do not give it unrestricted control over production systems. Secrets and sensitive values are redacted from investigation material before it reaches the model.
Broader agent capabilities require a separate permissions review. The agent API documentation covers access for external agents. The agent cookbook describes read-only tokens covering incidents, logs, metrics and context. Context tools remain scoped to the organization.
Some agent workflows can make permitted changes, so review each integration’s permissions separately from the built-in analyst’s read-only access. Sensitive enforcement actions, such as blocking an IP address or disabling access, are designed as proposals requiring human approval. The webhook subscription documentation identifies the event for an enforcement proposal. The proposed action is not executed before approval.
Collection and deployment boundaries to verify
Use an existing OTLP-capable agent or collector as the supported ingestion example. Before deciding what to collect, check how that path fits your current telemetry pipeline. The supplied facts explicitly state that a bundled infrastructure agent for host CPU and memory collection is not shipped.
The fact sheet does not establish hosting choices. Confirm deployment arrangements directly before making an architecture decision.
For background, the founder’s explanation attributes the product’s creation to the burden of managing separate operational and security tools. That account explains the design motivation. As an owner’s account, it does not provide independent evidence of investigation quality.
Where do NETSCOUT, HPE, IBM and Azure Monitor fit best?
These offerings serve different operational needs. Compare their roles before working through feature lists. 24Observe is built by our group, so weigh our view accordingly. We list it first because it connects reliability and security investigation.
24Observe: shared investigation for NOC, SOC and SRE teams
The AI analyst uses read-only tools to investigate incidents, examining logs and metrics alongside relationships and recent changes. Its context graph provides relationships between entities and the records supporting them. Traces feed signals into that graph; this recommendation covers shared investigation, with APM and distributed tracing outside its scope. Incident records link the investigation’s verdict to logs and topology.
Check hosting and data-location requirements with the team. Organizations must consent to model use at the organization level and may provide their own LLM key.
24Observe suits teams that want operational investigations and security triage to use the same incident context. That gives those teams a shared basis for evaluating both workflows.
During evaluation, ask engineers to reproduce the analyst’s explanation using its cited records. Do the agent permission boundaries also fit your approval policy?
NETSCOUT Omnis AI Insights: network context for an existing AIOps workflow
NETSCOUT describes Omnis AI Insights as contributing network evidence alongside the information already reaching an AIOps platform, supporting additional workflow automation. The offering rests on Omnis Sensor and Omnis Streamer. Its stated connections cover Splunk and ServiceNow, along with Elastic ELK Stack and DataDog.
The documentation supplied identifies these components and connections without establishing the hosting model. Before designing a deployment, verify where data collection happens, where processing runs and where records are stored.
A NOC seeking more network evidence in its current operations workflow is a suitable fit. For communications providers, enrichment from CRM tables can identify VIP subscribers and start monitoring their usage and experience. This is relevant when the affected subscribers determine an incident’s priority.
Test whether that network enrichment explains subscriber impact within your existing workflow. Which CRM records and collection components would your team need to maintain?
HPE Networking: network diagnosis, change guidance and mitigation
HPE Networking’s AIOps scope includes optimizing networks, diagnosing performance problems and applying autonomous mitigation. It can identify problems affecting networking, security or application performance. HPE describes using Zoom and Teams data, plus unstructured application data, to anticipate deterioration in user experience and identify its causes. That description establishes a specific use case, without establishing unrestricted visibility into applications.
HPE also describes recommendations for changes involving IoT onboarding and WAN expansion, as well as VXLAN misconfiguration. An AI search assistant provides configuration and troubleshooting help.
The supplied material leaves hosting unspecified. Establish which product applies, how it is hosted and which operational responsibilities remain with your team.
This offering suits network teams whose investigations regularly lead to configuration changes or mitigation. It is particularly relevant when collaboration experience provides important diagnostic evidence.
Before enabling actions, establish which remain recommendations and which can run autonomously. How will you test the requirements for approval and rollback, including escalation when an action needs further review?
IBM: distinguish Instana, IBM AIOps and consulting
IBM Instana Observability concentrates on visibility across the application stack, with performance monitoring updated continuously and AI-derived insights. IBM describes AI and automation as helping teams act proactively on application-stack problems.
The adjacent offerings have different roles. IBM AIOps combines visibility with operations capabilities to address operational complexity. IBM Consulting AIOps is a consulting approach that applies generative AI to operations and automation, with business priorities guiding the work.
Instana is available as SaaS or through self-hosting. The supplied facts leave deployment models unconfirmed for both IBM AIOps and IBM Consulting AIOps.
Evaluate Instana when an investigation starts with application performance. IBM AIOps is relevant to wider operational complexity. Consulting fits a requirement to define an operating approach around business needs.
Be explicit about what you are buying: application observability, an operations platform with broader scope, or consulting services. Which deliverables and deployment responsibilities are included in that particular engagement?
Azure Monitor: cross-signal investigation with built-in and custom analysis paths
Microsoft documents how its Observability Agent investigates using logs and traces alongside metrics, alerts and resource context. Teams can explore telemetry through natural-language analysis. Issues preserve the findings so people can review them, collaborate and continue the investigation.
The Intelligent view in Application Map displays relationships among services and highlights bottlenecks or concentrations of failures. Smart detection analyzes Application Insights telemetry for degrading performance and unusual failures, including possible causes. Dynamic thresholds use historical metric behavior, allowing thresholds to reflect more than fixed boundaries.
KQL functions provide time-series construction and forecasting, together with anomaly detection and root-cause analysis. Copilot in Azure can help troubleshoot Log Analytics and generate sample KQL in response to prompts.
Built-in KQL analysis works through Log Analytics and needs no separate integration, though portal or Query API limits apply. Microsoft states that these built-in machine-learning functions carry no additional charge. Costs for the surrounding monitoring service still need to be considered.
Custom pipelines require a separate engineering decision. They allow model customization and correlation with external data, while requiring integration with tools such as Jupyter Notebook. Queries and exports may add latency. Depending on the implementation, costs can include export and external storage, ingestion of scored results, and other services.
Azure Monitor suits teams already investigating through it who need to preserve findings, examine service dependencies and use query-based analysis. Assess proactive agent behavior carefully. Microsoft describes a direction toward system-initiated investigations and issue handling, limited to supported scenarios as those capabilities become available.
Can built-in investigation and KQL answer the questions your incidents raise? If a custom pipeline is needed, assess whether its value justifies owning the integration, accepting processing delays and paying the additional charges.
How do you choose a root cause analysis tool for your team?
Start with an incident your team needs to explain. Identify where the decisive evidence lives: network infrastructure, application dependencies, an Azure workspace, or combined security and reliability records. Map existing telemetry to investigation responsibilities before building a shortlist.
Match the evidence to the team
Treat these as conditional recommendations, with no overall ranking:
- 24Observe comes first because it addresses investigations shared by SOC, NOC and SRE teams. It is built by our group, so weigh our view accordingly. Monitoring and SIEM share storage and incident records; its analyst investigates through read-only tools. Check deployment requirements against your environment.
- NETSCOUT is worth evaluating when an existing AIOps platform lacks network context. Its dataset adds evidence to that platform. Confirm deployment requirements during evaluation.
- HPE Networking with AIOps suits evaluation by network-led teams investigating connectivity, security and application-performance problems. Check what deployment requires in your network.
- IBM Instana fits investigations dominated by application performance. It offers live application monitoring, with SaaS and self-hosted deployment options.
- Azure Monitor is a candidate when the evidence already sits in Azure workspaces. Its investigation agent connects telemetry with resource context, while Application Map supports dependency analysis.
For teams sharing SOC and reliability responsibilities, review SIEM and observability differences.
Score behaviour observed in trials
Run each trial against the same historical incidents. Base scores on what you observe rather than demonstrations: 0 means requirements are unmet, 1 means partial support and 2 means demonstrated fit. Keep scores blank until you have observations.
| Criterion | Trial acceptance question | Score |
|---|---|---|
| Entity coverage | Are affected entities and dependencies represented? | |
| Evidence quality | Can reviewers inspect records supporting each claim? | |
| Change context | Are preceding changes connected to affected entities? | |
| Contradictory observations | Does conflicting telemetry alter confidence or the proposed cause? | |
| Permission boundaries | Are investigation access and production changes separated? | |
| Deployment requirements | Can approved collectors and data routes supply required evidence? | |
| Operational maintenance | Who maintains collectors, rules, credentials and entity mappings? |
Ask where the data goes and how long evidence stays searchable. Establish the query constraints, then account for ingestion, export, storage and staff effort in the total operating cost. Confirm who already owns paging and escalation.
A purchase may supplement the tools you already use. Keep specialist metrics infrastructure or established paging responsibilities when the trial gives you no reason to replace them.
How do you roll out AIOps without handing over production control?
Use evidence-based gates to roll out AIOps. Promised deadlines should not determine progress. Keep investigation permissions separate from change permissions, and retain the existing incident process until engineers have checked the investigator’s work. A convincing explanation alone should never authorize production access.
Stage 1: bound the service and establish the data rules
Choose one service with a named owner, understood dependencies and past incidents with engineer-confirmed causes. Keep those diagnoses as the evaluation reference without sharing them with the investigator.
Before enabling investigation, document:
- Data handling: permitted fields, redaction, retention, model access and prohibited exports.
- Ownership: who reviews findings, handles escalations and authorizes access.
- Telemetry coverage: available logs, metrics, dependency information and change records. Include coverage gaps and inconsistent timestamps.
24Observe is built by our group, so weigh our view accordingly. Its administration documentation describes how redaction happens before storage and how audit records distinguish human activity from actions taken through tokens. The telemetry intake options include OTLP through collectors or agents already in place.
Exit criterion: the service owner and security reviewer accept the documented data flow, access boundaries and gaps in coverage.
Stage 2: investigate read-only beside the existing process
Engineers should continue using their current runbook. Run the investigator alongside them with credentials that cannot change production. Capture its proposed cause, uncertainty, incident grouping, citations and recommended action before comparing the findings with the established diagnosis.
Have an engineer open the cited records and check whether they support the explanation. The records must concern the correct entities and cover the relevant time window. Citing a genuine error does not establish its cause.
24Observe documents read-only agent permissions for access to incidents, logs, metrics and the graph. Its SIEM investigator uses investigation tools that cannot make changes and provides citations for retrieved answers.
Include deliberately difficult cases:
- Missing evidence: remove a decisive record and check whether the investigator expresses uncertainty.
- Misleading recent changes: include an unrelated deployment shortly before failure and require evidence of a causal connection.
- Multiple failures: introduce independent faults and check whether the investigator incorrectly merges them.
- Instructions inside logs: embed text asking the investigator to disregard rules or expose secrets. Treat the text as untrusted evidence with no authority to direct the investigation.
Exit criterion: reviewers accept the findings and failure handling, and tests confirm that the access restrictions hold.
Stage 3: measure usefulness before expanding
Set acceptance criteria before reviewing results. Apply the definitions consistently, and do not choose thresholds after seeing the scores.
| Metric | What to record |
|---|---|
| Engineer-validated cause identification | Investigations whose proposed cause an engineer confirms, divided by reviewed incidents with an established cause. Record inconclusive results separately. |
| Unsupported claims | Factual or causal assertions lacking supporting evidence, counted per investigation. |
| Citation usefulness | Whether each citation lets a reviewer locate relevant evidence and evaluate the associated claim. |
| Incorrect grouping | Independent failures merged together, or incidents with one established cause incorrectly separated. |
| Review effort | Engineer time spent checking evidence, correcting findings and documenting disposition per investigation. |
| Approval violations | Attempts to cross the authorized action boundary, distinguishing blocked attempts from executed actions. |
Expand only after the service owner, reviewing engineers and security team agree that the findings are useful and the access controls hold. Add one more bounded service and repeat the checks. Decide separately whether to consolidate paging.
Stage 4: gate every production change independently
Diagnostic automation can gather evidence or recommend a runbook. Changes to production need their own authorization path. Record the following for each proposed change:
- A named approver.
- The permitted action, resources and scope.
- A reversal procedure and its prerequisites.
- A verification check for recovery and unintended effects.
Execution credentials must remain separate from the proposal. In 24Observe, enforcement proposals, including IP blocking, require human authorization before proceeding. The response records preserve the verdict and supporting evidence, along with the authorization, action taken and resolution.
Reviewers also need to understand what automatic closure means. 24Observe marks an incident resolved when the condition that triggered it clears. This transition provides no proof that an agent repaired the problem or that anyone verified lasting recovery.
For a bounded trial, use the setup instructions and structure human-reviewed checks with the testing guide.
For further study, practitioners can explore our AI SOC Analyst course or Cybersecurity course. The Cybersecurity course includes 49 lab scenarios using 24Observe and an exercise in incident disposition.
AIOps FAQ: AI SRE, investigation evidence and adoption
What is AIOps used for?
AIOps applies AI and statistical analysis to operational data. It helps teams detect unusual behaviour, connect related events and investigate likely causes. Depending on configuration, it can recommend a response or initiate an automated workflow. Evaluate its data collection, analysis and automation functions separately. Useful anomaly detection does not automatically mean reliable diagnosis or safe remediation.
What is an AI SRE, and does it replace an engineer?
An AI SRE generally means an AI-assisted system that performs reliability tasks. It may investigate alerts, gather diagnostic evidence and suggest corrective steps. The label alone tells you little about its permissions or investigation depth. Engineers still need to define acceptable risk, verify conclusions and own production decisions. Ask vendors to demonstrate specific tasks and permission boundaries rather than accepting the label as a capability specification.
How does 24Observe investigate incidents?
24Observe is built by the Networkers Home group, so weigh our view accordingly. Its analyst investigates operational and security incidents using read-only access to telemetry, dependency relationships and recent changes. The documented investigation workflow produces a proposed cause with supporting citations and a recommended action.
The verdict documentation describes how incidents are classified, which entities are affected and what fixes are suggested. Each incident also includes an explanation of the analyst’s reasoning. Documenting these behaviours does not establish that every diagnosis will be correct.
What evidence should an AI incident investigation provide?
Require source records with timestamps, affected entities and relevant changes, along with an explanation connecting those observations to the proposed cause. The response should distinguish observations from inference and identify missing evidence. Engineers need records they can inspect, regardless of the confidence score.
For a documented example, 24Observe’s incident view connects the investigation result with logs and topology. Before authorising a change, check whether the cited records support the conclusion.
Can AI root cause analysis prove what caused an incident?
Correlation produces a hypothesis. A stronger diagnosis checks timing and dependencies against independent signals and competing explanations. A deployment preceding an outage remains a suspect until evidence connects its effects to the failure.
Data freshness also matters. The 24Observe context documentation says graph construction runs periodically, and relationships carry recency and confidence information. Check those details to assess whether a dependency relationship reflects conditions during the incident.
Does AIOps require autonomous production changes?
No. AIOps can recommend actions for engineers to execute or trigger automated responses where configuration permits. Keep permission to investigate separate from permission to modify production.
In 24Observe, the documented enforcement proposal event supports actions such as IP blocking that require approval before execution. This safeguard applies to the documented event; it does not establish how every integration or customer-built workflow behaves.
How should teams assess LLM data exposure?
Map which evidence reaches the model and what is removed beforehand. Establish who enables model use, then review provider terms and your own data-handling requirements separately.
For 24Observe, LLM processing requires an organisation-level opt-in, and organisations may supply their own LLM key. Its AI Analyst documentation states that secrets and sensitive values are redacted from investigation material before model processing. Test that redaction against representative data.
How should a team start adopting AIOps?
Choose a bounded incident category and run investigations without production-write permissions. Compare proposed causes against engineer-reviewed findings. Record unsupported claims and missing evidence alongside useful recommendations, then assess operational usefulness before expanding access.
For agent-based adoption, 24Observe’s agent cookbook documents read-only tokens and per-token activity limits. Before adding response actions, assign approval owners and define escalation paths and stop conditions. Review investigation quality and permission behaviour against your acceptance criteria before expanding scope.
Frequently asked questions
What does AIOps mean in practical IT operations?
AIOps means applying artificial intelligence and analytical methods to IT operations. Platforms bring together operational signals, identify unusual behavior, connect related events and help teams investigate causes. Depending on the system and its configuration, they may suggest a response or perform an automated task. The practical evaluation question is whether the output gives an engineer a better-supported explanation and a controlled next step, rather than simply another alert.
How is an AI SRE different from a traditional AIOps platform?
An AI SRE commonly describes an agent that investigates an incident, gathers supporting observations and presents a verdict. Traditional AIOps covers a broader set of functions, including aggregation, anomaly detection, event correlation and automation. These categories overlap, so the label alone tells you little. Examine what the system actually retrieves, whether its conclusions cite underlying records and which actions it can perform without a person approving them.
Can a root cause analysis tool prove what caused an outage?
A root cause analysis tool can identify a plausible cause by connecting dependencies, operational measurements, log patterns and preceding changes. That conclusion still needs validation. A recent deployment may be relevant without causing the failure, and incomplete telemetry may hide another explanation. Ask for supporting records, contradictory observations and a clear statement of uncertainty. Treat the proposed cause as a hypothesis to test against the incident evidence.
What should an AI incident investigation return?
A useful investigation should identify the affected components, explain the proposed cause, cite the supporting observations and recommend a next step. Its investigation record should show which evidence was checked and where uncertainty remains. A readable summary of investigation steps is different from hidden model reasoning. For operational review, inspectable records and a reproducible explanation matter more than a confident narrative that cannot be checked against the source data.
How does an AI SOC analyst differ from an AI SRE?
An AI SOC analyst focuses on whether activity is malicious, what was affected and which security response deserves consideration. An AI SRE focuses on reliability problems, dependencies and service restoration. Their evidence can overlap: network events, identity activity, application errors and recent changes may matter to both. A slowdown could require both investigations. The distinction is the question being tested and the response responsibility, rather than a completely separate telemetry source.
What does 24Observe provide for AI investigation?
24Observe is built by the Networkers Home group, so weigh our view accordingly. Its documented analyst uses read-only investigation tools to examine telemetry and contextual relationships, then supplies a verdict supported by citations, a reasoning trace and a suggested next step. LLM processing requires organization-level opt-in, and organizations may use their own provider key. Trace ingestion contributes context; this guide does not position it as an APM or distributed tracing product.
Does read-only investigation mean an AI system cannot change production?
Read-only investigation limits the tools used to gather evidence, but it does not establish the permissions of every connected agent or response workflow. Review those separately. In 24Observe, documented sensitive enforcement proposals require human approval rather than immediate execution. During adoption, apply an explicit approval policy to every production-changing action and verify the available credentials, permitted operations, audit records and reversal procedure before enabling a response.
Does using your own LLM key keep incident data private?
Using your own key gives the organization control over a model-provider credential; it does not by itself establish data location, provider retention or local processing. Check what evidence is sent, how sensitive content is removed and which provider terms apply. 24Observe documents organization-level opt-in and redaction before investigation evidence reaches the model. Those controls still need to be assessed alongside your organization's data handling requirements.