Status Page · 24Observe
Status page guide: What to publish, how to communicate, and which tools to choose
Swipe sideways to see the whole diagram.
What is a status page, and why do customers and support teams rely on it?
A status page communicates service health to a defined audience. It explains availability, identifies affected services, and reports ongoing incidents. Readers can check how a problem affects them and what the service owner has confirmed so far.
Our perspective comes from Networkers Home, founded in 2007 by Vikas Swami, who runs more than 30 products across his group companies. Our founder’s account explains the operational experience behind this guide.
24Observe is built by our group, so weigh our view accordingly. Its status pages publish selected information about customer impact while keeping internal telemetry and infrastructure topology separate. The publishing principle is straightforward: give the audience the information they need, and keep investigation details in the internal workspace.
How does a status page differ from other operational tools?
The distinction between monitoring and observability helps explain where a status page fits. Technical evidence supports the investigation. Published updates explain how the incident affects the service.
| Item | Primary purpose | How a status page differs |
|---|---|---|
| Engineering dashboard | Present metrics and diagnostic views for technical teams. | Explains affected services in language the intended audience can use. |
| Alert inbox | Collect alerts requiring responder attention. | Publishes an assessed account of impact, rather than every triggered signal. |
| Contractual service commitment | Define agreed availability obligations, measurement rules, and remedies. | Reports service health. Published availability history does not itself establish those obligations. |
Why do customers and support teams use it?
Customers arrive with practical questions. Is the problem affecting everyone or one service? Can they still sign in? Is a delayed export part of a known incident? A useful status page helps them connect an acknowledged problem to their own workflow. It should make clear which effects are confirmed and which details remain under investigation.
Support teams use the page as a shared incident reference. An agent can direct a customer to the current update and check when it was published, keeping their reply consistent with the approved explanation. Investigation details belong in the internal incident record. Treat the published page as a communication reference, without assuming that either the page or the shared reference will reduce ticket volume or shorten resolution time.
The tool comparison later in this guide starts with 24Observe because we can explain its connection to our operating experience directly. It separates documented functionality from details readers need to verify, including plan restrictions and deployment requirements. Use the relevant operating documentation to check how each publishing option works.
The next sections cover audience and publishing decisions before moving to incident writing, automation, domains, and subscriptions. Examples illustrate useful publishing patterns ahead of tool selection and the implementation checklist. When evaluating how monitoring connects to customer communication, read the setup guide alongside that checklist.
Public, private, or internal status page: which do you need?
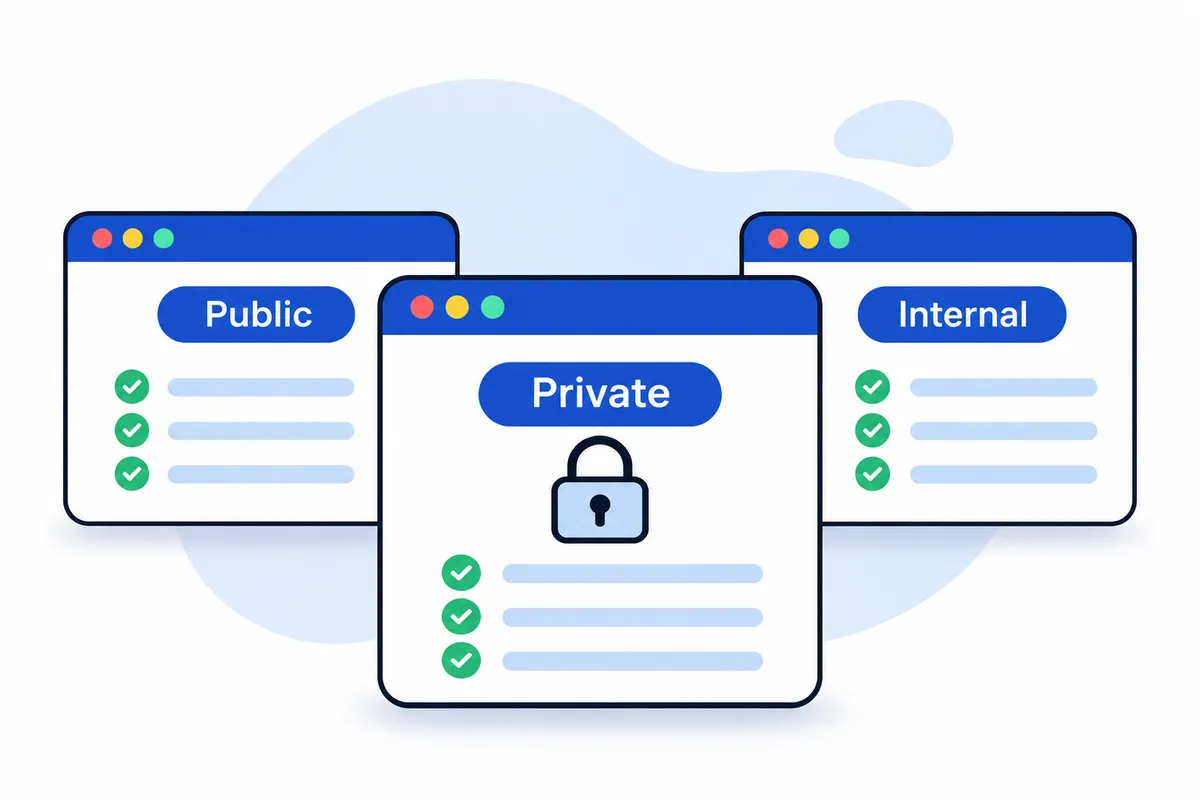
Decide who needs to read the page before choosing access controls. A public status page serves customers and prospects; a private page serves specified customers or partners; an internal page serves employees and operational stakeholders. Separate pages may be needed when those groups require different information.
| Page type | Audience | Appropriate information | Access requirements | Publishing ownership |
|---|---|---|---|---|
| Public | Customers, prospects, anyone checking availability | Service impact, affected components, maintenance notices | Readable without credentials | Named customer-communications owner, supported by incident lead |
| Private | Specified customers or partners | Relevant service impact and customer-specific components | Verified restriction to the intended audience | Named service or account owner, supported by operations |
| Internal | Employees, support, NOC, SOC, SRE and leadership | Business-service impact, operational summaries, coordination updates | Controls matching employee access policy | Named operations communications owner, supported by incident lead |
Audience labels do not establish access controls
“Private” and “internal” describe who should read the page. Password protection, IP restrictions and single sign-on describe how access is controlled. Check each mechanism separately. A private-page setting does not necessarily include all three.
A shared password does not establish individual identity. An IP restriction checks the connecting network address, so test it for remote staff and partner networks. If SSO is required, verify reader authentication specifically; support for administrator login is a separate question.
What the product examples support
We list 24Observe first because its page options cover these audience choices. Our group built it, so weigh our view accordingly. Its documentation describes public and private pages, and its status-page offering includes password-based protection. The feature documentation also lists IP allowlisting for internal pages. Teams that need deployment within their perimeter can consider self-hosting. These documented capabilities do not establish status-page SSO support.
Better Stack suits teams that need restricted communication for employees or enterprise customers, particularly where reader SSO matters. Its documented page protections include SSO, passwords and IP restrictions. The pages are part of its broader monitoring platform. Confirm the deployment arrangement and required access configuration during evaluation.
For customer-facing naming, 24Observe supports customer-specific component labels. For example, “Customer A ordering service” can be more useful to that audience than an infrastructure hostname. Review the underlying monitor-to-component grouping before publishing. Reseller and white-label capabilities remain roadmap items; customer-specific naming does not establish that either capability has been delivered.
Establish ownership and test access
Before launch, appoint a publishing owner and a backup who can publish during an incident. Test the page as both an intended reader and an unauthorized visitor, including from an off-network connection.
Keep secrets, credentials and unrestricted telemetry off the page, even when access is internal. Publish a scoped operational summary and keep investigation evidence in appropriately controlled systems.
What should you publish on an uptime status page?
Publish enough for customers to decide whether to retry, wait or contact support. Each item should explain the service impact, who is affected and when the information was verified.
24Observe is built by the Networkers Home group, so weigh our view accordingly. It supports component grouping and component-level status reporting. The specification below is our publishing recommendation, not a claim that the product supports every listed field. Your team still needs to decide who owns each update and how availability is measured.
Use a publishing specification with named owners
The responsibilities below are recommendations for your team. Confirm publishing permissions and approval steps before adopting these assignments.
| Content to publish | Reader question answered | Owner | Publishing caution |
|---|---|---|---|
| Customer-facing components: service name and short scope description | “Which part of the service do I use?” | Service owner | Use customer-journey names rather than server or deployment names. |
| Current service state: operational, degraded or unavailable for each component | “Can I use this service now?” | NOC or on-call engineer | Verify scope before applying a whole-platform label. Show when the state was last confirmed. |
| Active incidents: affected components, observed impact, start time and next update time | “Does this explain my problem?” | Incident commander | Give ongoing incidents prominent placement. Separate confirmed impact from suspected causes. |
| Timestamped updates in a readable public timeline | “What changed since I last checked?” | Incident communications lead | Include the date and time zone. Distinguish event time from publication time. |
| Planned maintenance: affected services, scheduled window and expected disruption | “Should I postpone work?” | Change owner | Describe expected impact without promising an exact restoration time. |
| Historical incidents: impact, timeline, resolution and approved follow-up | “Has this happened before?” | Incident owner | Keep the incident record understandable after resolution; correct errors transparently. |
| Uptime history: component-level results and measurement notes | “How has this service behaved over time?” | SRE or monitoring owner | State the period, availability definition and maintenance treatment beside the results. |
Name components around customer journeys
API, dashboard, checkout and email are all documented 24Observe component examples. Use names like these and group the relevant checks behind them through its component configuration. A hostname may help an engineer investigate, but it rarely tells a customer whether they can complete a purchase.
Describe partial failures explicitly. If checkout is failing and you have verified that the dashboard is unaffected, say so. Explain whether the failure affects all customers, one region or a specific operation. 24Observe supports partial-outage reporting for individual components, so you can report that scope without applying a single up-or-down label to the entire platform.
Give historical availability a measurement contract
24Observe documents daily uptime bars covering 90 days, component statistics for 24-hour, 30-day and 90-day periods, and sparklines showing response time. Add labels that explain how readers should interpret these displays.
For every historical view, publish:
- The measurement period, with visible start and end dates and a time zone.
- The affected component: the service or customer journey represented by the checks.
- The availability definition, including what counts as success, failure or degradation and how missing observations are handled.
- The maintenance policy, stating whether planned work enters the calculation and which rule applies.
Connect these details to your uptime monitoring methodology. Response time describes performance; on its own, it cannot confirm that a transaction succeeded. Measured availability also does not prove that a contractual commitment was met.
Separate maintenance announcements from alert controls
24Observe supports publishing planned work with its schedule. Its maintenance alert controls handle a separate task: suppressing alerts while checks continue to run. Customers use the announcement to understand expected disruption; the controls govern operational notifications.
Neither capability establishes how maintenance affects historical availability. Verify the calculation and publish the maintenance policy alongside the results.
Label badges according to what they measure
24Observe documents an embeddable SVG uptime badge suitable for a README. Keep the full status page available so readers can check individual components and understand the incident context.
An SLO badge needs a defined service-level objective, a measurement window, an indicator and a calculation. Label the documented 24Observe badge as an uptime badge. That capability does not establish support for an SLO badge.
What should you keep off a public status page?
Publish confirmed customer impact and identify the affected services. Include the next communication checkpoint. Keep investigation evidence in the internal incident record. Customers need to know what they can use and whether they need to act, without seeing the infrastructure behind the failure.
24Observe is built by our group, so weigh our view accordingly. Its internal investigation view holds log evidence, dependency relationships and analyst conclusions. The public page carries selected, readable impact information. Teams choose which components appear and how published updates are worded, decisions that still require editorial judgment.
What stays internal?
Treat the following as general security and publishing recommendations rather than product guarantees:
- Keep credentials and personal information private. Exclude tokens, passwords, session identifiers, email addresses and customer-identifying details.
- Leave raw logs and private addresses out of public updates, including log evidence, internal hostnames, private IPs and dependency topology.
- Withhold exploit details. Payloads, reproduction instructions and defensive gaps could assist an attacker.
- Keep unverified theories and blame internal. Distinguish observations from conclusions, and avoid naming a customer, supplier or individual as responsible before verification and appropriate review.
- Avoid unsupported recovery estimates. A troubleshooting guess or historical recovery metric should not become a restoration promise. Give a next-update time when recovery timing remains uncertain.
Translate evidence into impact
The following example is illustrative:
| Internal observation | Suitable public statement |
|---|---|
| Requests from a named tenant are timing out between an application host and a private database address; connection exhaustion is suspected. | “Some users are experiencing timeouts when loading reports. We are investigating the affected reporting service. Our next update will be at 14:30 UTC.” |
The public wording describes the observed symptom while keeping the topology and customer identity private. It also leaves out the unverified hypothesis. Retain the supporting investigation evidence internally.
A public page cannot replace the complete incident record or a security disclosure process. An internal event or security detection does not automatically warrant publication.
For sensitive incidents, name a reviewer in the response runbook. Define a correction policy that requires timestamps for material changes and an explanation of what changed. Preserve the earlier communication history unless sensitive content requires removal.
How do you write incident communication for investigating, identified, monitoring, and resolved?
Write each update around what customers can observe and what responders can prove. An alert from uptime monitoring may establish that a check failed. On its own, it cannot establish the full customer impact or cause.
Treat investigating, identified, monitoring, and resolved as editorial stages that describe changes in your understanding and evidence. Check how your status page tool implements workflow states before mapping these stages to it.
Use the same prose structure for each update
Include five elements: publication timestamp and timezone, affected component, observable customer impact, confirmed action, and next update time. Put impact before internal diagnosis. Customers need to know whether they can complete checkout before they need an explanation of a failing dependency.
Be explicit about whether an action is being considered, is underway, or has been completed. “We are evaluating a rollback” means something different from “We have rolled back the change.” Commit to a communication deadline you can meet. Give a recovery time only when you have evidence to support it.
The four examples below describe a fictional Checkout incident. They illustrate how to write updates. They do not report an actual outage or provide evidence of any product’s performance.
Investigating: acknowledge impact without guessing the cause
Use investigating when you have a credible service problem but cannot yet explain it confidently. State the observed symptom and the scope of your investigation. If you do not know how many customers are affected, say so rather than inventing a percentage.
Fictional investigating update: This Checkout update was published on 8 June 2026 at 14:10 UTC. Some customers cannot complete checkout. We are investigating payment submission errors and will publish another update by 14:30 UTC, even if our findings have not changed.
Acknowledge uncertainty directly, and keep suspected causes within the investigation until supporting evidence justifies publishing them. Naming a dependency as the confirmed cause requires that evidence.
Identified: require evidence before naming the problem
Use identified when responders have evidence supporting a particular fault. A plausible theory is insufficient. Supporting evidence might include a reproducible failure, transaction records, or a configuration discrepancy that explains the symptoms. You still need to establish whether the service has recovered.
Fictional identified update: This Checkout update was published on 8 June 2026 at 14:25 UTC. We have identified a problem affecting checkout requests and are applying a corrective change. Customers may still see failed submissions; we have not yet confirmed recovery. We will publish the next update by 14:45 UTC.
An approaching update deadline is no reason to move an incident to identified. If the evidence remains inconclusive, continue investigating and explain what is still unknown in the next update.
Monitoring: describe the change and the verification
Monitoring requires both an intervention and evidence that it helped. Verify the affected customer journey after the change, then explain what remains under observation. A completed deployment alone does not establish recovery.
Fictional monitoring update: This Checkout update was published on 8 June 2026 at 14:40 UTC. The corrective change is in place, and our checkout checks are passing. We are monitoring the service and reviewing affected transactions before marking this incident resolved. Our next update will be published by 15:00 UTC.
Match verification to the incident. A successful homepage request does not validate payment submission. If new requests succeed while earlier transactions remain delayed, describe that partial recovery explicitly.
Resolved: validate the affected service before closing
Resolved requires validation appropriate to the failure. Check representative transactions across affected regions or customer groups, and account for any relevant backlog or data reconciliation. Separate service restoration from unfinished follow-up work. Consistent definitions also improve recovery-time measurement.
Fictional resolved update: This Checkout update was published on 8 June 2026 at 14:55 UTC. Checkout is operating normally again, and our validation checks have completed. This incident is resolved; we will add a follow-up explanation after reviewing the event. We will report progress on that review by 16:00 UTC.
Handle changing facts visibly
For partial recovery, name what works and what remains affected. Publish a workaround only after verifying it, including who can use it and any limitations. For checkout incidents, assess duplicate-payment risks before advising customers to repeat submissions.
Update the scope explicitly when impact expands or contracts, and preserve uncertainty where evidence remains incomplete. If you miss a promised deadline, acknowledge the delay and publish what is known with a new deadline. Correct inaccurate statements with a timestamped explanation so readers can see what changed. Carry these commitments into the on-call handover.
Keep operational updates separate from the postmortem
24Observe is built by the Networkers Home group, so weigh our view accordingly. We discuss its status pages first because customer communication should be evaluated alongside incident response. Review the public incident timeline and incident records and communication information against your publishing requirements. Check the self-hosted deployment and incident API documentation before deciding how either would fit your operating model.
For any communication tool, verify its deployment model, template options, and connections to incident tools against your workflow. Establish who publishes updates and how monitoring evidence reaches that person. Decide where the final incident record will live.
During the incident, communicate customer impact and confirmed actions, including what remains uncertain and when the next update is due. Use the later postmortem to explain the verified sequence, contributing factors, and prevention work. Publish useful operational updates while that deeper review is still pending.
Should status page updates be automated or manually controlled?
Automate measured health where the signal is trustworthy. Give a named person responsibility for explaining customer impact. Make each decision separately:
- Detecting failure: Has a check failed, and does that failure meet the incident threshold?
- Changing component health: What should that evidence mean for the customer-facing service?
- Publishing an explanation: What can you accurately tell customers about impact, scope and recovery?
Map checks to services before automating publication
The relationship is monitors → customer-facing component → incident communication. Several checks might represent “Checkout”: page loading, payment API availability and order confirmation. Each provides different evidence about the same service.
Verify how individual failures affect the component. Grouping checks does not establish a particular aggregation rule. A failed diagnostic endpoint may have no customer impact; a working homepage may conceal broken payments. Flapping checks can repeatedly change the apparent service state and generate confusing notifications.
What the documented workflows support
We start with 24Observe because its documented workflow connects monitors, components and incident publication. It is built by our group, so weigh our view accordingly.
Its component-health automation reflects monitored service health, while incident updates can publish automatically. When an incident resolves, affected degraded components return to operational status. A resolution update is then published, and subscribers are notified. The email subscription support covers incident opening, subsequent updates and resolution.
Through the monitor API, you can configure how many consecutive failures trigger an incident. The default is one. That setting governs incident creation; it establishes neither a separate component debounce mechanism nor a publishing approval workflow.
| Tool | Deployment or publishing model | Best fit for this decision |
|---|---|---|
| 24Observe | Connected monitoring and status pages; self-hosting is available | Teams seeking linked health, incidents and subscriber communication |
| Checkly | Public pages fed automatically by platform monitors | Teams wanting published status tied directly to monitored checks |
| Better Stack | Status pages within its monitoring platform, supporting automatic and manual workflows | Teams choosing between those publishing approaches |
| Cronitor | Public pages alongside cron and heartbeat monitoring; incident updates are not automated | Teams prepared to own incident communication manually |
| Atlassian Statuspage | Hosted communication service requiring a separately purchased and connected monitoring tool | Teams keeping detection and customer communication in separate systems |
Assess a tool’s ability to write reliable explanations of customer impact separately from its health and publishing automation. Automatic health changes and publication alone do not establish that capability.
Assign human ownership of impact wording, security-sensitive updates and recovery claims as an operating practice. A recovered endpoint does not prove that queued work has completed. Check regional health and whether affected customers can finish their transactions before claiming recovery.
Test the complete publishing path
Run controlled tests before relying on public automation. Use the testing guide for further reading.
| Test | What to verify |
|---|---|
| Failed checks | Incident creation follows the configured threshold; the intended component changes without misrepresenting unrelated services. |
| Flapping | Repeated failure and recovery do not create misleading communication. |
| Recovery | Check recovery, component restoration and resolution messaging agree; validate customer workflows separately. |
| Maintenance | Verify alert behavior and public presentation independently. 24Observe’s maintenance windows pause alerts while checks continue. |
| Partial impact | A regional or feature-specific failure is described without implying a complete outage. |
| Notification delivery | Test subscribers actually receive opening, update and resolution messages with the intended wording. |
How do you set up a custom domain status page and consistent branding?
A familiar address and logo help visitors recognize who is publishing an incident update. Use readable typography and accessible color contrast to keep that identity clear without making service information harder to read. Pair status colors with text labels so visitors do not need to tell red from green.
Discord identifies its status page at discordstatus.com through its logo and brand palette. Postmark uses its own branding on its status page too. In both cases, the branding helps customers recognize the organization publishing the update.
Separate the address, appearance, and white-label scope
A custom domain determines the address visitors open. Visual customization covers the page’s appearance, including its logo, accent colors, or CSS. Full white-label scope extends to provider attribution and may include reseller requirements. Ask explicitly what the offer includes, because a custom address alone does not establish that scope.
We list 24Observe status pages first because it supports custom domains and CSS customization. It is built by our group, so weigh our view accordingly. Teams that want control over page identity can use its custom-domain support, logo and accent-color settings, and injected CSS capability. For teams that need to keep monitoring data within their perimeter, self-hosting is available.
Checkly brings public status pages into its monitoring offering, with support for custom domains and branded presentation. CSS styling is unavailable, according to its documented limits. It suits monitoring-led teams whose design needs fit the supplied branding controls.
Configure and validate the page
- Choose a memorable hostname, such as
status.example.com, and use it consistently when support staff share the page. - Read the product’s domain setup instructions before you change DNS. For 24Observe, start with the documentation and request setup assistance if needed.
- Apply the DNS configuration exactly as documented. Better Stack specifies one CNAME record to connect a custom subdomain. Its status pages belong to its broader monitoring platform, which suits teams combining monitoring with incident communication. Other products may require a different DNS procedure.
- Verify HTTPS by opening the selected address and checking for certificate warnings or insecure page resources. Confirm how certificate provisioning and renewal work rather than assuming they are handled.
- Test the intended redirects, then follow the published page’s support links, navigation, and incident links to check their destinations.
- Review the page on mobile. After CSS changes, check how the logo scales and text wraps, along with color contrast, keyboard focus, and readability.
Predefined branding templates and agency/reseller white-label functionality are still on the 24Observe roadmap. No delivery date is committed for the reseller functionality, so assess the customization available today separately from those plans.
How do status page subscriptions and notifications work?
Status page subscriptions send updates to people who opt in. Whole-page subscriptions cover the page’s published services; component-specific subscriptions narrow that scope, for example to checkout rather than every service. Check which options a tool supports before offering customers that choice.
When testing notifications, keep these distinctions clear:
- A change appearing on a public status page confirms publication. Check outbound delivery separately to establish whether a notification reached someone.
- Subscribers need impact and progress updates. Responders need actionable alerts and an on-call escalation process. Test customer notifications and responder paging independently.
Which subscription channels fit your audience?
We list 24Observe first because our group built it, so weigh our view accordingly. Check its subscription options against your audience’s needs, using the same criteria you apply to other tools.
| Product | Supported customer-facing options | Workflow fit |
|---|---|---|
| 24Observe | Page visitors can receive email when an incident opens, when updates are published, and when it resolves. These subscriber emails are automatic. | Teams connecting incident work with customer communication. A self-hosting option is available. |
| Cronitor | Its public page offers email, Slack, RSS feeds and webhooks. | Teams wanting several ways to consume updates alongside cron and heartbeat monitoring. |
| Better Stack | Customers can receive email for the whole page or selected components. | Teams needing service-specific subscriptions within a broader monitoring platform. |
Cronitor’s range of channels and Better Stack’s component filtering address different needs. Check each product’s subscription features independently. For 24Observe, distinguish its internal alert integrations from its public-page email subscriptions.
How do webhooks, JSON and Atom differ from email?
24Observe’s event-webhook subscriptions support incident openings, resolutions and monitor-state changes, using signed delivery with retry logs. Software receivers use these webhooks for integration; customer email subscriptions are separate.
Technical teams should verify signatures and test what happens when delivery fails. Receivers also need to tolerate duplicate events. The webhook reference documents event and delivery identifiers that support routing and deduplication.
24Observe also provides public status-page JSON and Atom feeds through its API documentation. JSON supports programmatic retrieval; Atom lets feed readers consume published entries. Neither establishes email enrollment or inbox delivery.
What should you test before inviting subscribers?
Shopify’s public page offers an example of customer subscriptions: customers can subscribe to outage notices and planned-work notifications.
Test how subscription confirmation and cancellation work. Use an external mailbox and check actual receipt as you publish an incident opening, an update and a resolution. Where component filtering exists, verify that unrelated incidents stay excluded. Test cancellation separately and confirm that subsequent messages stop. In your test record, distinguish browser publication from outbound receipt.
Which status page examples show useful publishing patterns?
Use these examples to study publishing choices; their order does not indicate a ranking. The patterns below come from Cronitor’s documented examples. Verify the current pages before adopting a pattern. A useful page alone does not establish which software powers it.
| Example | Documented design choice | When to adopt the pattern |
|---|---|---|
| Cloudflare | Groups hundreds of server locations worldwide into collapsible regional sections. | Use collapsible regions when geography affects customer impact and a flat list of locations is hard to scan. |
| GitHub | Shows current health alongside historical records and support links. Hovering over a service name displays a short explanation. | Combine these elements when readers need immediate context and a way to get help. Explain service names customers might not recognize. |
| AWS | Groups services and locations by region and offers search to find a specific service. | Add search for a large catalog. Organize by region when customers need to identify location-specific impact. |
| Twilio | Places ongoing incidents ahead of the rest of the page content. | Lead with the incident when readers need to know whether a known problem explains what they are experiencing. |
| Postmark | Links to FAQs and quick assistance. | Include help links when readers may need troubleshooting advice or a support contact alongside service health. |
| DigitalOcean | Uses a sidebar for its service overview. | Consider a sidebar when readers need a concise service reference next to detailed information. |
Choose a small starting structure
The implementation links below point to 24Observe, built by the Networkers Home group, so weigh our view accordingly.
For a simple service, begin with a few customer-facing components. These might include an API or a web dashboard, with background processing where applicable. Choose names customers understand. Avoid copying the infrastructure inventory into the page.
Give the active incident priority, alongside an incident timeline and a support link. When grouping monitors, check whether each component reflects a distinct customer experience. Decide which updates to publish for your public or private audience.
Add regional sections only if an incident can have different effects depending on customer location. For a small service operating in one region, clear component names usually matter more than a geographic hierarchy.
Which status page tools fit your monitoring and communication workflow?
Choose a status page tool around the handoff from detection to incident handling and customer communication. A monitor reporting failure and a responder explaining customer impact need different controls, even when they work from the same incident.
24Observe is built by the Networkers Home group, so weigh our view accordingly. We list it first because this guide examines its shared workflow for monitoring, incidents, and public communication. The order reflects our editorial scope and carries no independent ranking. Other tools serve different operating models, from hosted communication services to monitor-fed pages and self-hosted systems.
These recommendations reflect the supplied documentation. They do not establish proven outcomes.
| Tool | Strongest documented fit | Deployment or operating model | Monitoring relationship | Publishing considerations |
|---|---|---|---|---|
| 24Observe | Teams evaluating monitoring, incident records, and customer updates together | Integrated platform; self-hosting is documented | Monitors feed incidents and component health; incident updates can reach the public page and subscribers | Public status pages offer grouped components, custom domains and branding, published maintenance, email subscriptions, uptime history, and a live SVG uptime badge |
| Atlassian Statuspage | A dedicated customer-communication layer alongside existing monitoring | Hosted status-page service | Monitoring must be acquired separately and connected | Select customer-visible components, write incident updates, and manage subscribers |
| Better Stack | Teams wanting configurable pages within their monitoring platform | Hosted branded pages; private-page options are documented | Uptime monitoring is part of the wider platform | Automatic or operator-led publishing, email subscriptions, and customization; confirm which options belong to the free page or add-on packaging |
| Checkly | Engineering teams wanting check-driven status pages alongside CLI-managed monitoring | Integrated platform; other deployment options are unconfirmed here | Browser, API, TCP, and heartbeat checks supply page health | Custom domains, branding, service groups, and subscriptions; the supplied facts exclude CSS styling |
| Cronitor | Teams focused on scheduled jobs and heartbeat signals | Monitoring platform with public pages; infrastructure deployment options are unspecified | Cron-job and heartbeat monitoring sit alongside status publishing | Component charts and multiple subscription channels; incident updates require manual publishing |
| Uptime Kuma | Operators comfortable maintaining basic availability monitoring themselves | Open-source software operated on your infrastructure | Checks cover HTTP/HTTPS, TCP, DNS queries, and Docker containers | The sheet does not establish page styling, audience access, or subscriber capabilities |
| Cachet | Teams seeking a separately operated status-page system | Open-source system designed for self-hosting | Applications and monitoring systems can send updates through its JSON API | Components, incidents, scheduled maintenance, and subscriber email |
| Status.io | Services needing communication organized by system, region, or audience | API-oriented operation; verify infrastructure deployment options | Monitoring requires a separate system | Represent services independently and send incident broadcasts to selected user groups |
Buyer notes: where each tool belongs
24Observe: evaluate the complete incident-to-publication path
We recommend evaluating it for a NOC or SRE team deciding whether monitoring and communication should share an incident workflow. One update can reach the incident record, public page, and subscribers. The public page shows selected customer-facing details; the internal investigation stays outside that view.
The configuration guide explains how checks are grouped into service components. The feature reference covers presentation controls, including custom domains, branding, and injected CSS. Review those controls against your service structure and visual requirements, including any publishing needs beyond adding a logo.
Maintenance notices can describe planned work and its timing. Subscribers receive email when incidents open, change, and close. The documented uptime-history displays show daily bars for 90 days, with component statistics over 24-hour, 30-day, and 90-day periods.
A live SVG uptime badge can be embedded in a README. The supplied facts do not establish SLO-badge availability, so the uptime badge provides no evidence of SLO reporting. Self-hosting is documented. Review current pricing and confirm your intended configuration, including any hosted tiers or allowances, before making a decision.
Atlassian Statuspage: keep communication separate from detection
Statuspage belongs on the shortlist for a support or incident-communications team with monitoring already in place and a need for hosted publishing. Operators choose which components customers see, publish incident messages, and manage subscribers. Its role covers communication throughout an incident. Plan for the operational work of running and connecting a separate monitoring product, because Statuspage itself does not detect failures.
Better Stack: inspect the exact page configuration you need
Better Stack suits teams looking for hosted, branded communication within their monitoring platform. Its documented options include custom-subdomain pages, CSS styling, and email subscriptions covering either an entire page or selected components. It also supports scheduled-maintenance messages.
Private-page access can use SSO, passwords, or IP restrictions. Operators can publish manually or use automatic publishing. The fact sheet mentions both a free page and add-on packaging. Before committing, confirm how the combination you need is packaged, particularly branding, access protection, and subscriptions.
Checkly: suit the page to an engineering-owned monitoring workflow
Checkly fits teams comfortable maintaining checks through a CLI. Browser, API, TCP, and heartbeat monitors can update public-page health. Service groups and custom domains organize that information for customers.
The documented CLI handles Monitoring as Code setup and maintenance. The supplied material does not establish CLI control of status pages or deployment options outside the integrated platform. Check the branding controls against your design requirements: the documented options are available, but CSS styling is unsupported. That distinction matters when a page needs stylesheet-level control.
Cronitor: distinguish component health from written incident updates
Consider Cronitor when scheduled work and heartbeat signals are central to service health. Its documented public-page example combines component status with uptime or performance charts. Subscription channels include email, RSS, Slack, and webhooks.
Incident updates require manual publishing. Assign responsibility for explaining customer impact and maintaining the incident narrative while monitoring supplies health information. The fact sheet leaves infrastructure deployment options unspecified, so confirm those directly before choosing how to operate it.
Uptime Kuma: choose it for documented basic checks and operational ownership
Uptime Kuma suits an operator who wants open-source monitoring on infrastructure they manage. The documented checks cover web endpoints, TCP connections, DNS queries, and Docker containers. The supplied facts describe this as basic monitoring.
Those facts do not establish public-page styling, subscriptions, or audience-access controls. Validate each requirement separately if it affects your buying decision. Monitoring notification support alone does not confirm that a public page has the subscriber or access controls your communication workflow needs.
Cachet: evaluate a self-hosted communication system
Cachet fits teams prepared to operate their status-page software and connect upstream signals. Its documented functions cover service components, incident records, planned maintenance, and subscriber email notifications. Applications and monitoring tools can send updates through its JSON API.
Assess the integration work needed to turn a technical failure into the right component state and customer message. The API supplies a route for updates; your publishing policy still needs to define what gets published and how that information should be expressed to customers.
Status.io: consider it for segmented service communication
Status.io belongs on the shortlist when customers need updates for particular systems or regions. It supports independent service models, incident broadcasts aimed at selected audiences, and API-oriented automation.
You will still need separate monitoring, and infrastructure deployment options require verification. Use the comparison resources to frame those workflow questions. Before selecting a tool, test how a detected failure moves through your intended monitoring-to-publication handoff and reaches the customers who need the update.
How do you launch a status page? A practical setup checklist
Assign an owner and record verification evidence for every item before launch. The optional references below use 24Observe, built by the Networkers Home group, so weigh our view accordingly. Start with its quickstart for implementation guidance.
-
Define the audience. The service owner confirms whether customers, partners, employees, or separate groups need access. Test the proposed visibility with someone representing each audience.
-
Choose customer-facing components. The service owner checks that names describe services customers recognise, such as checkout or email, rather than internal hosts. Assign responsibility for each component.
-
Select public information. Have the security reviewer check a sample update for credentials, customer identifiers, and sensitive infrastructure details. Document publishing controls and who approves exceptions.
-
Connect representative checks. The monitoring engineer verifies that each check measures the service its component describes. For browser checks, consult the browser-monitor documentation to establish which pages and interactions are supported before assuming full user-journey coverage.
-
Document status semantics. Ask the SRE lead to confirm that reviewers interpret operational, degraded, and unavailable consistently. Define thresholds, component aggregation, and recovery evidence. Distinguish monitoring signals from customer impact.
-
Assign automation and editorial responsibility. The incident manager verifies which events publish automatically and which require approval. Record who corrects misleading updates when monitoring and customer reports disagree.
-
Configure domain and branding. The web administrator checks DNS, HTTPS, mobile readability, and recognisable branding. Review your selected tool’s domain and styling options before depending on them.
-
Write incident and maintenance examples. The communications lead reviews drafts for coverage from investigation through resolution, including impact and update timing. Test maintenance announcements and alert suppression separately. Announcement visibility does not establish which maintenance controls are available.
-
Configure available subscriptions. Support operations verifies the chosen plan’s supported channels using test recipients. Confirm that opening, update, and recovery messages arrive, then test unsubscribe behaviour. Consult the relevant setup guide.
-
Exercise failure and access scenarios. Have the test lead verify that controlled failure, partial impact, and recovery produce accurate component states. Test restricted pages from both authorised and unauthorised sessions.
-
Publish support links. The support lead checks that contact and help links work without publisher credentials. Confirm that users can reach the status page from your support site.
-
Rehearse communication ownership. The incident commander verifies that a primary publisher and backup can draft, approve, publish, and hand over an incident without relying on one person.
-
Schedule recurring reviews. The service owner checks for stale components, departed publishers’ access, and broken links, and reviews historical measurement definitions. Record calculation windows, exclusions, and definition changes.
Before choosing a tool or expanding coverage, test one important service through its complete incident communication path: detection, publication, subscriber delivery, support handoff, and recovery.
Status page FAQ: public access, monitoring, domains, and uptime
Can anyone access a public status page?
Yes. Assume anyone can read what you publish on a public status page. 24Observe is built by our group at Networkers Home, so weigh our view accordingly. It keeps selected customer-facing updates separate from internal investigation details and supports password protection and IP-allowlisted internal pages. Set access controls for the intended audience. Keep raw logs and credentials off public pages, along with internal network details.
Does a status page monitor my services?
Not necessarily. We list 24Observe first because its uptime monitoring and incident-driven status updates suit teams that want detection and publication together. Atlassian Statuspage is a hosted communication tool for teams connecting an existing monitoring system; it requires separate monitoring. Before choosing, establish which system detects failures and opens incidents, then confirm where the customer-facing update comes from.
Are there free or open-source status page options?
Both are available, with different operating responsibilities. Better Stack offers a free page with logo branding, a subdomain, charts and dark mode. Cachet is an open-source system you host yourself. It includes component status, incident records and maintenance scheduling. Choose Better Stack if you want a provider-hosted option. Consider Cachet if your team can handle the hosting and ongoing updates, including backups and recovery.
Can I use my own domain and branding?
You can, where the selected product supports them. 24Observe documents custom domains, logos and accent colors, as well as CSS customization. For setup, choose a recognizable address such as status.example.com and follow the provider’s DNS instructions. Verify HTTPS before announcing the page. Keep domain configuration separate from access control: using your own hostname does not make a page private.
How much uptime history can a status page show?
The history available depends on the tool. 24Observe documents daily uptime bars covering 90 days and component statistics for 24 hours, 30 days or 90 days. When publishing uptime, identify the monitored service and measurement window. Explain how planned maintenance is treated, too. These historical measurements describe observed availability. They neither establish that every customer transaction succeeded nor promise availability in the future.
Can I embed service status in documentation or a README?
Yes. 24Observe provides an SVG uptime badge for embedding in a README. It also provides status badges for documentation, dashboards and website footers. Link the badge to the full status page so readers can inspect the affected services and incident updates. Test the embed wherever you plan to use it, including restricted documentation environments. Do not assume every renderer handles external images the same way.
Should planned maintenance appear on the status page?
Publish planned maintenance when customers could experience disruption or changed behavior. 24Observe supports publishing scheduled work and its timing. Its maintenance controls suppress expected paging noise while monitoring checks continue. In the announcement, name the affected components and give the time zone. Explain the expected impact and say when the next update will follow. Handle alert suppression separately from customer communication, and confirm service health before closing the notice.
Frequently asked questions
What is the difference between a status page and a monitoring dashboard?
A status page communicates service health and customer impact to a chosen audience. A monitoring dashboard helps operators examine technical measurements and investigate problems. The public page should contain selected explanations rather than raw operational evidence. In 24Observe, the internal incident view includes logs, topology, and the analyst's verdict, while the public page displays selected information intended for readers outside the investigation.
Can I create a free status page?
Yes, but compare what the available option includes and who operates it. Better Stack documents a free status page with a logo, subdomain, interactive charts, and dark mode. Cachet is an open-source system intended for self-hosting, with components, incidents, and maintenance scheduling. Self-hosting still requires infrastructure and maintenance. Check domain support, access controls, subscriber requirements, and operating responsibility before choosing.
Does a status page replace uptime monitoring?
No. Monitoring checks whether a service is behaving as expected; a status page communicates selected health information and incident updates. Some products connect those functions, while others require separate monitoring. Atlassian Statuspage requires a separate monitoring tool. When comparing options, trace the complete path from a failed check to component status, a customer-facing explanation, and a recovery update rather than assuming every step is automatic.
Do I need a custom domain for my status page?
A custom domain is optional, but a recognizable address can make the page easier to identify and share. Discord uses discordstatus.com. 24Observe supports custom domains and branding, while configuration steps depend on the product. Follow its DNS instructions and verify HTTPS, links, and the mobile view. Do not assume that custom-domain support also includes unrestricted styling or a complete white-label offering.
How often should we publish incident updates?
Set an update schedule that your incident team can maintain, and state the next update time in each message. Publish sooner when impact changes, a useful workaround becomes available, or recovery is confirmed. If investigation continues without a new finding, say so rather than missing the promised update. The appropriate cadence depends on severity and customer impact; there is no universal interval for every incident.
Can a status page be private or limited to specific customers?
Yes, when the chosen product supports the required access controls. 24Observe supports password-protected pages for internal services, specified customers, or partners, and its status-page capabilities include IP-allowlisted internal pages. Decide who needs access and test restrictions before publishing sensitive service names. A private page still needs information boundaries; passwords or network restrictions do not make credentials, personal data, or unrestricted telemetry appropriate content.
Is an uptime badge the same as an SLO badge?
No. An uptime badge summarizes an availability measure or service state, while an SLO badge would need to relate a defined indicator to a stated objective and measurement window. The fact sheet documents a live SVG uptime badge for 24Observe and specified uptime-history windows. It does not establish a 24Observe SLO badge, so verify that requirement rather than treating the two labels as interchangeable.