Prometheus Vs Grafana · 24Observe
Prometheus vs Grafana: How They Differ and When to Use Both
Swipe sideways to see the whole diagram.
Prometheus vs Grafana: what is the short answer?
Prometheus collects metrics, stores timestamped samples and evaluates rules. Grafana queries connected sources to display their data. Prometheus typically pulls measurements over HTTP and keeps them as time series. Its rules can generate derived metrics or trigger alerts. Grafana builds dashboards from query results and lets operators explore data from connected sources, including Prometheus.
Collection versus visualization is a useful starting point, though the responsibilities overlap. Prometheus can graph data, and Grafana supports alert rules alongside dashboards. Operators need to decide which component owns each responsibility, particularly where alert conditions should be evaluated.
The product boundaries matter when choosing a deployment:
- 24Observe comes first here because it addresses consolidation across these responsibilities. It is built by our group, so weigh our view accordingly. Its metrics, logs, uptime checks and security detections feed a common incident workflow, supported by a context graph. Teams can choose hosted or self-hosted deployment.
- Prometheus is an open-source toolkit for monitoring, with a standalone server. It suits teams collecting and querying numerical measurements stored as time series.
- Grafana OSS provides visualization and alerting in a self-managed deployment. It suits teams that need dashboards spanning connected sources and are prepared to maintain the software themselves.
- Grafana Cloud is the managed offering from Grafana Labs. It includes storage backends for metrics, traces and logs, making it relevant to teams considering a managed deployment. The broader Grafana stack includes distinct components such as Loki, Tempo and Mimir. Do not assume those capabilities belong to Grafana OSS.
The article examines component roles before turning to consolidation.
We are Networkers Home, a training institute offering cybersecurity and AI SOC Analyst courses. Vikas Swami established the institute in 2007. His account of founding 24Observe explains his reasons for wanting to reduce multi-tool complexity. Read it as background on our perspective, not as independent validation of the product.
How does Prometheus monitoring work?
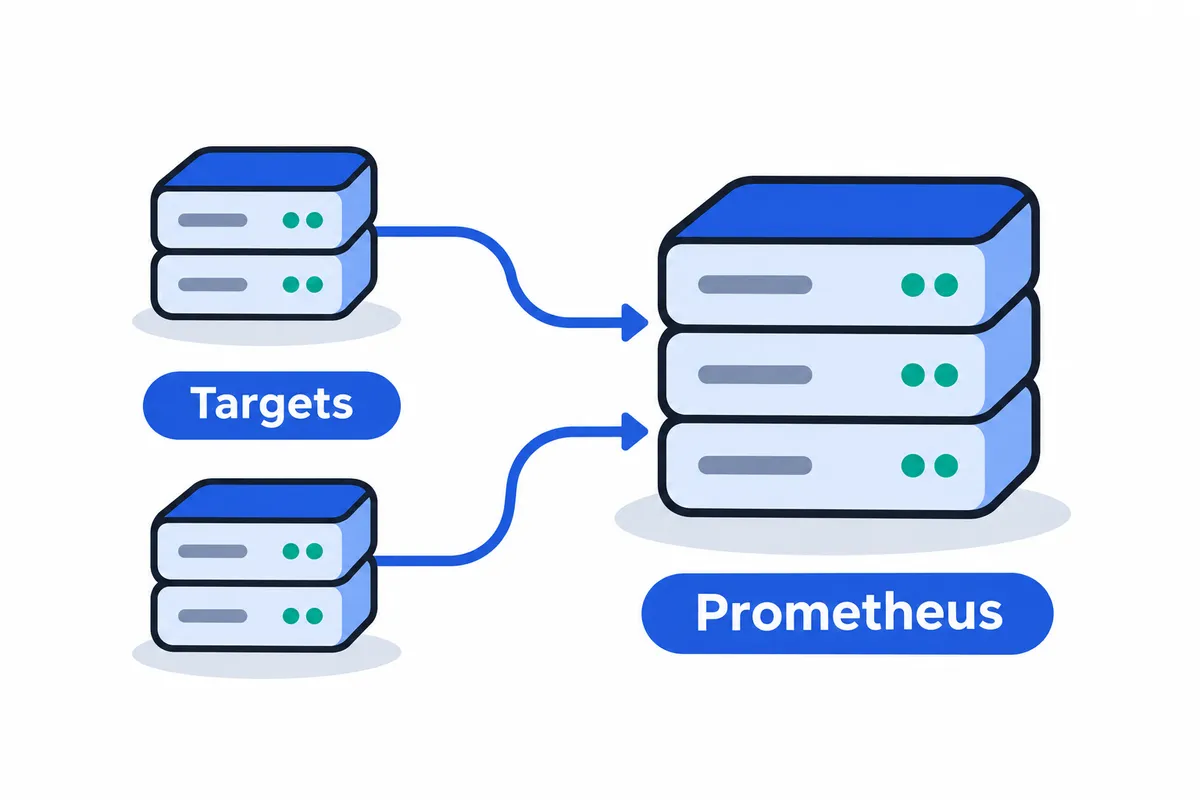
Prometheus collects numeric measurements from HTTP endpoints, stores timestamped samples, and evaluates queries and rules against that history. Collection starts with exposing measurements and identifying targets. Prometheus then scrapes their endpoints, stores the samples, and makes that data available for queries and rule evaluation.
Consider a hypothetical checkout application. Its deployment exposes request counts and request-duration measurements from the application, plus CPU and memory measurements through a host exporter.
The pull model: Prometheus requests the measurements
Prometheus initiates HTTP requests to configured targets at specified intervals. Each collection request is a scrape: the target exposes measurements, and the Prometheus server retrieves them.
Targets enter the configuration through either a static list or service discovery. For our checkout deployment, a static configuration could identify the application endpoint and the host exporter endpoint. Discovery identifies targets as the environment changes. Prometheus scrapes the targets identified by either method.
A successful scrape confirms that Prometheus can collect from a metrics endpoint. It does not establish that the checkout transaction works. Metrics collection, API monitoring, and uptime monitoring answer different operational questions. Those background guides are published by 24Observe, built by our founder’s group, so weigh our view accordingly.
Instrumentation and exporters: where metrics originate
Application instrumentation means adding measurement points to code, typically through a Prometheus client library. In our example, developers instrument request handling so the application exposes measurements about requests and their duration.
An exporter adapts measurements from an existing system or service into metrics that Prometheus can scrape. Our hypothetical host exporter exposes machine measurements without requiring the checkout application to measure the operating system itself. The Prometheus ecosystem also includes exporters for services such as HAProxy.
For a suitable short-lived workload, a job can send its measurements to Pushgateway. Prometheus then scrapes that intermediary. This accommodates jobs that might finish between collection intervals while keeping pull-based collection as the primary model.
These numeric measurements differ from individual event records, which are covered in the related log-management guide.
Labeled time series: how measurements retain identity
Prometheus identifies a series through its metric name together with its labels. Each stored sample contributes a value and timestamp to that series.
Suppose our application exposes a hypothetical metric named checkout_requests_total. Labels might distinguish the service, application instance, and response category. Measurements with the same name but different instance labels belong to separate series.
Changing a label value creates another series. Adding or removing a label also changes its identity, so renaming an instance creates a separate series rather than renaming its historical measurements.
Label design therefore affects how you operate the system. A response category offers a bounded way to divide traffic. A unique identifier for every request would continually introduce new identities. Choose dimensions that support troubleshooting and aggregation; avoid trying to preserve every event inside metric labels.
PromQL: filtering and aggregating the stored data
PromQL is the query language used to select and process Prometheus metrics. Filtering narrows the series under consideration; aggregation combines measurements across selected dimensions.
For checkout troubleshooting, filtering could select only production application instances or one response category. Aggregation could combine request measurements across instances while retaining a service-level view. Engineers can move from a service-wide question to an instance-level investigation without changing the collection mechanism.
The labels available at collection time determine which distinctions remain available later. If the data never distinguishes response categories, a query cannot reconstruct that missing distinction.
Our guides to monitoring versus observability and observability fundamentals provide broader context for interpreting these signals. For separate product context, see 24Observe’s metrics and alerting pages.
Storage: local samples and autonomous servers
The Prometheus server keeps the samples it scrapes in local storage. Each server operates independently, without requiring distributed storage or another remote service for its core operation.
Operators need to plan capacity around that architecture. Metric volume and label design affect memory consumption. Time-series history consumes disk space, while a heavy PromQL workload can increase memory pressure.
For our checkout deployment, estimate the series produced by application instances, host measurements, and label combinations. Then test representative queries and rules against the expected workload. Counting metric names alone misses the series multiplication caused by labels. Plan memory and disk together, and validate those estimates with measurements. A universal sizing threshold without supporting evidence is no substitute for testing the expected workload.
Rule evaluation: detection before notification
Prometheus evaluates rules against collected data. Recording rules calculate results and save them as additional series. Alerting rules evaluate conditions that can generate alerts.
In our example, a recording rule could preserve an aggregated request measurement, while an alerting rule could detect an unacceptable request-duration condition.
Prometheus evaluates the alert condition, and Alertmanager handles the resulting alerts. Alertmanager groups, deduplicates, and routes notifications, with silences and inhibition controlling notification behavior. Operational practices around alert fatigue, on-call rotations, and recovery-time measurement remain separate responsibilities.
Prometheus suits numeric infrastructure monitoring and dynamic service environments where labeled measurements support investigation and alerting. Its sampled history provides operational evidence. Using that history as an exact billing ledger requires completeness and detail that collection may lack, making it unsuitable for accurately charging for every request.
How do Grafana dashboards, data sources, and alerting work?
Grafana OSS provides a query, exploration, visualization, and alerting layer over connected data backends. An SRE investigating latency or a NOC engineer checking infrastructure health can use it to query data and inspect the results.
The connected backend stores the data Grafana displays. When Grafana queries Prometheus, for example, the metric samples remain in Prometheus. Grafana presents the results. The same division of responsibility applies to log databases and trace backends: the interface and the underlying store serve separate roles.
From a data source to a reusable dashboard
Building a reusable dashboard involves four steps:
- Connect the data source you want to query. For Prometheus, configure its network endpoint as a Grafana data source. Grafana’s plugin system supports other connections too, including SQL databases and operational tools.
- Write the query and check its results. With Prometheus, use PromQL to select and aggregate the relevant series. Start with a specific operational question, such as whether request latency increased for one service. The connected backend determines which query operations are available.
- Build a panel using a visualization that fits the result. Give it a clear title and meaningful units, with enough context for a reader to distinguish normal variation from a problem. Plugins can extend the available panel types.
- Add dashboard variables in place of fixed service or environment selections. This lets you switch one dashboard between production and test, or narrow an overview to a particular service, where those dimensions exist in the source data.
Grafana’s dashboard library provides starting points. Before using an imported dashboard, check its queries against your metric names and labels to see whether they match your instrumentation.
Explore first, then add context
Dashboards suit recurring questions. Grafana’s exploratory querying and drilldown support investigations where each result determines what you check next. Split view lets you compare separate queries, sources, or time windows side by side.
For example, you could inspect service metrics alongside relevant logs, or compare an incident window with an earlier period. Each backend retains its own query semantics within that shared interface. Available operations depend on the source and plugin, so metric calculations, log searches, and trace investigations need to be handled accordingly.
Annotations place event markers on graphs. You can enter them manually or retrieve them from connected sources, then inspect the event details. Marking a deployment beside a latency increase helps establish when each occurred. That timing alone does not prove causation.
How Grafana Alerting uses connected data
Grafana Alerting evaluates metric data and log-based conditions across supported sources. It supports queries and expressions involving multiple sources, visual creation of metric rules, and centralized rule management.
When designing an alert, check whether the relevant source supports the operation you need. Then check that the query answers a clearly defined operational question. Even a chart that an engineer finds useful needs a precise condition before it can serve as an alert.
OSS, Enterprise, and Cloud are deployment choices
These options share Grafana’s core. The table sets out their hosting arrangements and included capabilities so you can assess which fits your team.
| Option | Deployment and capabilities | Who it suits |
|---|---|---|
| Grafana OSS | Free open-source software that your team hosts and maintains | Teams wanting self-managed dashboards, exploration, and alerting |
| Grafana Enterprise | Self-managed commercial edition with additional plugins, reporting, expanded access controls, and official support | Teams needing those commercial capabilities while retaining operational control |
| Grafana Cloud | Grafana Labs operates the service, with metrics, log, and trace backends included; a free tier is available | Teams preferring a managed platform |
Check permission requirements carefully. Grafana supports teams and permissions for dashboards and folders. Grafana Enterprise supports data-source permissions and automatic mapping of identity-system teams. Verify support in your chosen edition rather than assuming these capabilities are exclusive to Enterprise or available across every edition.
Where the wider Grafana stack fits
Grafana works with logs and traces as well as metrics. Within the LGTM stack, Grafana provides visualization. Loki handles logs, Tempo handles traces, and Mimir supplies metrics storage, including long-term storage for Prometheus. Alloy is an OpenTelemetry Collector distribution that also supports Prometheus.
24Observe is built by our group, so weigh our view accordingly. For architectural context, read the guides to observability, monitoring versus observability, and log management. Consider distributed tracing when reviewing how service activity connects across components.
For operational planning, use the guides to custom observability and on-call rotations. Include alert fatigue and MTTR measurement in that review by deciding which alerts require action and how your team defines recovery.
Prometheus vs Grafana: How do their capabilities compare?
24Observe is built by our group at Networkers Home, so weigh our view accordingly. We list it first because it is the consolidation option being evaluated. Column order does not indicate a ranking.
Prometheus collects and stores metrics, then evaluates rules against them. Grafana queries connected sources for dashboards, exploration, and alerting. These responsibilities should guide your decision about keeping separate components or consolidating them.
| Capability | 24Observe | Prometheus | Grafana |
|---|---|---|---|
| Main responsibility | Brings monitoring and security together through shared telemetry and incident workflows. | Open-source toolkit for metrics monitoring and alerting. | Visualization, data exploration, and alerting across connected sources. |
| Collection | Accepts metrics through OTLP/HTTP ingestion; its Sensor collects host metrics and logs. | Pulls metrics over HTTP from instrumented targets and exporters; Pushgateway supports short-lived jobs. | Connects to data sources; collection components in its ecosystem include Alloy. |
| Storage | Monitoring and security share a data store. | Stores scraped samples locally; individual servers run autonomously without distributed storage. | OSS and Enterprise query connected backends; Cloud includes managed backends for metrics, traces, and logs. |
| Query approach | Supports metric-name and bucketed-series queries. Test these against your query requirements. | PromQL filters and aggregates labeled time series. | The selected source determines the query approach, including PromQL for Prometheus. |
| Visualization | Metric charts and dashboards; check how your required panels would be recreated. | Includes graphing options for examining metric queries. | Customizable dashboards, reusable variables, plugins, and ad-hoc exploration. |
| Alert evaluation | Metric thresholds support a required breach duration and open incidents. | Evaluates expressions to generate alerts or record derived series. | Grafana Alerting uses queries and expressions across sources to evaluate metric or log conditions. |
| Notification or incident handling | A shared incident queue provides lifecycle management and routing for operational and security events. | Alertmanager separately groups, deduplicates, silences, and routes generated alerts. | Alerting controls notification destinations and timing; assess additional incident requirements separately. |
| Logs and security scope | Log management and SIEM detections share the incident pipeline. | Handles numeric time series; its scope excludes log storage and SIEM investigations. | Explores connected log sources; Loki supplies log storage within the wider stack. |
| Deployment | Hosted or self-hosted, with the same APIs, data models, and behavior. | Self-operated, open-source metrics system built around autonomous servers. | OSS is self-managed; Enterprise adds commercial capabilities to self-managed deployment. Grafana Cloud is managed by Grafana Labs. |
| Who should evaluate it | NOC/SOC teams considering consolidated telemetry and incident handling. | Teams considering self-operated metrics collection, storage, and PromQL rules. | Teams considering dashboards and exploration across multiple backends, with deployment choice by edition. |
If you have an established Grafana dashboard library or carefully tuned PromQL rules, test their migration explicitly. Evaluate query behavior, dashboard requirements, and feature coverage separately rather than assuming equivalence. The Grafana comparison page explains consolidation from 24Observe’s perspective. It is not an independent assessment. Before treating any platform as a replacement, test representative queries alongside the panels and alert conditions that depend on them.
How do Prometheus and Grafana work together?
Prometheus collects and stores metrics; Grafana queries that data and presents it in dashboards. Consider a hypothetical checkout application running in Kubernetes. The operational task is to connect application measurements and cluster resource metrics to useful panels, then establish who responds when a condition needs attention.
Follow the metrics from application to dashboard
- Expose measurements at the source. Instrument the checkout application with a Prometheus client library to expose request counts and latency measurements. For a service that needs an exporter, the exporter supplies the metrics endpoint. Decide which labels identify the service and environment, and document how they relate to Kubernetes namespace and pod labels.
Collect infrastructure context alongside application measurements. Prometheus can scrape kubelet, cAdvisor and Kubernetes API metrics, including those exposed by kube-apiserver. These sources support views of resource consumption and cluster activity. Application instrumentation answers questions about checkout performance, while Kubernetes measurements provide the surrounding resource context.
- Make targets discoverable and scrape them. Configure Prometheus to find the intended targets through service discovery or an explicit target list. Prometheus pulls measurements over HTTP at configured intervals and writes the samples into its local time-series storage. Queries use the metric names, timestamps and labels stored with those samples.
For a Kubernetes installation, the kube-prometheus-stack Helm chart is one option: it installs Prometheus, Grafana and supporting management components. That packaged arrangement is optional. Separate charts also exist for deploying the two tools individually. Choose the deployment arrangement deliberately rather than letting the package determine your architecture.
- Connect Grafana to the stored metrics. Configure a Prometheus data source in Grafana using the Prometheus instance’s network endpoint. Grafana sends queries to this source. Use the Prometheus endpoint for this connection, rather than the application’s metrics endpoint.
Build panels with PromQL expressions referencing the collected series. Start with operational questions:
- Has checkout response time changed during the selected period?
- Is the application processing more or fewer requests?
- Does the change coincide with increased CPU or memory consumption for the relevant pods or nodes?
Grafana renders the query results, so a panel can only display application measurements that instrumentation exposed and Prometheus collected.
Check the complete path before trusting a dashboard
Use this acceptance checklist before handing the dashboard to an on-call engineer:
- Verify that Prometheus can reach each metrics endpoint and Grafana can reach the configured Prometheus endpoint.
- Confirm that service discovery or static configuration includes the intended application and Kubernetes targets.
- Check that request, latency and resource series exist and contain recent samples.
- Ensure application and infrastructure queries use the intended service, namespace and pod identifiers.
- Test each panel’s expression against the chosen data source, label filters and time range.
- Record where each alert rule is evaluated, which team maintains it and which on-call team receives its alerts.
Trace a resource-pressure incident
Suppose checkout memory consumption rises while response times deteriorate. In this example, cAdvisor exposes the resource measurements and application instrumentation exposes latency measurements. Prometheus scrapes both and stores the changing series.
Grafana queries those series and displays memory and latency panels over the same period. The changes give the responder evidence to investigate, though correlation alone does not establish the cause.
Assume the team placed its resource-pressure rule in Prometheus. Prometheus evaluates the rule and generates an alert when its condition is met. Alertmanager receives that alert and sends the configured notification. The responder uses Grafana’s dashboard context during the investigation.
Alternatively, the team can define the rule in Grafana Alerting. Decide where each rule belongs and avoid creating equivalent alerts in both systems without an explicit reason and ownership plan. Document notification routing and the division of responsibilities alongside the rule. Specify who maintains it and who responds.
24Observe is built by our group, so weigh our view accordingly. For your broader operational review, keep observability fundamentals, monitoring versus observability, API monitoring, custom observability planning, log management, alert fatigue, on-call rotations and measuring MTTR on the checklist. For each topic, document what your team needs to measure and which evidence it will use. Assign ownership of the resulting operational decisions.
What does Prometheus Alertmanager do, and where does Grafana Alerting fit?
Separate three responsibilities when deciding where alerts should live:
- Evaluate conditions: Prometheus checks its alerting rules against collected metrics and forwards resulting alerts to Alertmanager.
- Manage firing alerts: Alertmanager retains active alerts, groups related ones, suppresses duplicates, and applies routing, inhibition, and silences.
- Send notifications: Alertmanager delivers messages through configured receivers, such as email or PagerDuty.
An alert becoming active and a responder receiving a notification are different events. Keep that distinction clear when diagnosing alert fatigue. The references below include material from 24Observe, built by the Networkers Home group, so weigh our view accordingly.
What happens during an upstream network failure?
Suppose an upstream router fails, making a cluster and its services unreachable. You have configured rules to detect both cluster unreachability and individual service failures.
| Alertmanager function | Behavior in this hypothetical failure |
|---|---|
| Grouping | Combine related cluster alerts into a compact notification instead of sending a separate message for every service. |
| Duplicate suppression | Deduplicate repeated copies of an alert rather than treating each arrival as a distinct notification. |
| Routing | Use the routing configuration to select the receiver responsible for the affected cluster. |
| Inhibition | Suppress dependent service notifications while the matching cluster-unreachable alert is firing. |
| Timed silence | Mute matching notifications during a scheduled router maintenance interval. |
Inhibition expresses a dependency; a silence expresses a time-bound exception. Configure inhibition rules to suppress downstream notifications while the specified upstream alert is active. Review that relationship whenever the intended upstream and downstream responsibilities change.
For planned maintenance, create a silence in Alertmanager’s web interface with matchers and a defined interval. Alerts matching every condition in that active silence generate no notifications. Check notification suppression separately from the conditions that caused an alert to fire.
Agree on the on-call process and assign responsibility before an outage, then configure grouping and suppression to support that process.
Where does Grafana Alerting fit?
Grafana Alerting can evaluate queries and expressions against supported metrics or log sources, including multiple sources. Its central interface lets teams maintain alert rules and configure notification destinations and timing. Available channels include Slack, email, SMS, and PagerDuty. For log-based conditions, distinguish the log-management pipeline from the rule that evaluates its results.
Choose alert ownership to suit your operating model. Established Prometheus rules can stay with Alertmanager when that path works for your team. Grafana Alerting may suit teams managing conditions across supported sources. Both can remain in use if their responsibilities are explicit.
Document which path owns each condition, which receiver it uses, and who maintains it as part of your observability design. Recreating the same rule in both paths without intent can produce duplicate notifications.
What should you verify operationally?
For high availability, configure Prometheus to send alerts to every Alertmanager instance, without placing a load balancer between them. Each instance accepts alerts independently; peers synchronize silence information and notification state.
Test the complete path:
- Trigger a controlled failure and verify that the intended receiver gets the message.
- Restore service and check recovery-notification behavior against your configuration.
- Exercise inhibition and confirm unrelated alerts remain actionable.
- Test silence matching, expiration, and maintenance boundaries.
Validate notification delivery separately from what the dashboard shows. For broader context, see monitoring versus observability and observability concepts. Use an appropriate uptime test for external availability. When assessing MTTR, record detection and notification times, and include these checks in your broader observability practice. Wherever your team implements acknowledgment, escalation, and incident closure, verify those steps separately.
What do Prometheus and Grafana leave to other tools?
In a basic, self-managed deployment, Prometheus collects metrics and Grafana queries them. That gives you numeric monitoring, dashboards, and metric-based alerts. Collecting other investigative evidence and establishing a response process require additional work. Grafana’s wider ecosystem supports a broader setup, and adding data sources and workflows changes what the stack can answer.
| Operational question | Capability needed beyond the basic metrics setup |
|---|---|
| Why did this service produce an error? | Searchable application and system logs, with timestamps and useful fields. Log management supplies evidence that an error counter cannot contain. |
| Where did this request slow down or fail? | Instrumentation, trace collection, and a trace backend. Distributed tracing connects work performed across services. |
| Can someone outside our network reach this public URL? | An external probe that requests the URL and evaluates the response. Uptime monitoring tests reachability instead of inferring it from internal metrics. |
| Does this authentication activity suggest an attack? | Authentication events, security-focused rules, investigation context, and detection maintenance. SIEM and observability have overlapping data needs but different operational responsibilities. |
| Who acknowledged the incident, and when was it resolved? | A durable incident record, ownership, acknowledgment, and resolution history. These also support consistent recovery-time measurement. |
We start with 24Observe, built by our Networkers Home group, as an example of an integrated product because it connects monitoring with incident workflows. We disclose that affiliation so you can weigh our view accordingly. Its uptime capability page shows how URL checks connect to incidents. The incident model puts monitoring and security work in a shared queue with a common lifecycle. Hosted and self-hosted deployment options suit teams seeking shared operational workflows.
Grafana can remain the investigation interface
With suitable sources connected, Grafana can display logs and traces. Within the broader Grafana stack, Loki serves as the log database and Tempo as the trace backend. Teams that need these signals can add them to their existing deployment and continue using Grafana.
Grafana Cloud offers a managed deployment: Grafana Labs runs the platform, with backends for metrics, logs, and traces included. It suits teams that want those capabilities without operating each backend themselves. A comparison between the basic Prometheus and Grafana pair and a broader platform should include this managed option.
Alert conditions still need operational engineering
A failed-login counter crossing a threshold can give a useful warning. Security detection engineering also examines the accounts and source addresses involved. Analysts need to assess whether the pattern has a legitimate explanation and identify evidence that supports investigation. Rules require testing and tuning, with someone responsible for maintaining them.
Grafana Alerting can evaluate log entries alongside metrics, including events relevant to security. The detection programme around that data determines how those alerts support investigation.
Notification delivery requires similar operational decisions. Alertmanager handles alert grouping and routing, while Grafana Alerting also manages notification destinations. Sending a message or silencing an alert does not establish who accepted responsibility or record recovery. Define those steps in an incident workflow, with explicit on-call responsibilities.
More components create both choice and coordination work
Specialized backends and response tools can lead to tool sprawl. Each addition may bring configuration and access policies to maintain, upgrades to manage, and notification routing to coordinate. Context also needs to pass between tools. Responders need consistent service names and timestamps as they move between evidence sources.
A modular setup lets separate teams own their domains and choose specialized capabilities. Assess whether those boundaries make responsibility clear or leave responders piecing together the incident history manually.
When should you keep Prometheus and Grafana?
Evaluate 24Observe (built by our group, so weigh our view accordingly) when the unmet requirement is shared logs, uptime checks, security detections and incident handling. We list it first as a consolidation option to evaluate against those requirements. Check whether monitoring and security detections would share the data and incident records your responders need. When assessing hosted and self-hosted deployments, verify API, data model and detection behaviour rather than assuming equivalence.
Keep Prometheus and Grafana when their existing strengths match your requirements. Review the metric queries and dashboard workflows your team uses across environments. Assess whether responders can narrow an investigation without rebuilding panels. There are good reasons to retain the pair if responders know the dashboards, trust their PromQL rules and need to choose backends independently.
Use our documented fit guidance to frame an evaluation of 24Observe. If your main requirement involves extensively tailored Grafana dashboards and carefully developed PromQL alert logic, assess that engineering investment against current requirements and the work it already supports. A replacement needs a clear operational justification.
Measure the work before changing the stack
Use recent incidents and maintenance records to answer these questions:
- Who owns the collectors, storage, dashboards and rules? Is there backup expertise for each responsibility?
- How much engineering time goes into operating the stack, including upgrades, capacity management, recovery tests and alert tuning?
- Which signals must remain inside your perimeter? Does the proposed deployment satisfy those data restrictions?
- How often do investigation handoffs require responders to transfer evidence between monitoring and security teams? Would shared incident handling address the friction you have observed?
- What would migration involve? Identify the panels, expressions, permissions and runbooks that need rebuilding, then establish how you will test equivalent coverage and preserve rollback.
Extending a working stack may carry less risk because it preserves familiar queries and response procedures while addressing a defined gap. Keeping backend choices independent also helps when teams have different storage requirements.
If you are considering Grafana Cloud because operating backends is the problem, verify which hosting and maintenance responsibilities the proposed arrangement would remove. Check coverage for metrics, logs and traces, along with connectivity to existing Prometheus installations. For a self-managed Grafana OSS deployment, establish who will own hosting and maintenance.
Choose retain, extend or pilot
- Retain the stack when coverage is sufficient, ownership is clear and maintenance fits available capacity.
- Extend it when you can add a specific missing backend or workflow without disrupting trusted dashboards and rules.
- Pilot consolidation when cross-team evidence handling is the gap you have measured. Start by evaluating checks and logs through gradual adoption, then assess detection and on-call needs before replacing established coverage.
When does 24Observe make sense as one platform?
24Observe is built by the Networkers Home group, so weigh our view accordingly. Consider it when your operational work spans metrics, logs, availability checks and security investigations, and you want those signals handled through a shared store and incident model.
Consolidation makes sense when responders need evidence from separate workflows. A CPU alert, an unavailable endpoint and a suspicious authentication event raise different questions, but investigating them may require the same host history and logs. 24Observe brings those inputs into a common operational workflow. Evaluate that shared workflow alongside what your established Prometheus and Grafana deployment already provides.
How the signals become actionable
24Observe accepts metrics through OTLP/HTTP and supports queries for metric names and time-bucketed series. Its Sensor gathers host logs together with CPU, memory, disk and network measurements through one installation. Host metrics require no additional agent.
Metric rules specify a series, comparison, required breach duration and severity. Use the sustained-breach setting to distinguish a momentary excursion from a condition that persists long enough to warrant investigation. When triggered, the rule creates an incident through the pipeline used for failed checks and security detections.
For a NOC and SOC working on the same infrastructure, the following inputs allow collection, investigation evidence and response records to live together:
- Searchable logs let responders examine events for debugging. Security detections evaluate the same ingestion pipeline, and a saved search can become a time series for charting and alerting.
- Uptime checks cover HTTP, TCP, TLS, ping, content and cron-heartbeats, providing external or scheduled-job signals. Failed checks feed the incident workflow.
- SIEM detections send security findings into the shared response pipeline without requiring a separate security ingestion path.
One incident lifecycle, with evidence-led investigation
24Observe uses a common queue, lifecycle and routing model for operational and security incidents. Responders can acknowledge an incident without resolving it. Incidents resolve automatically when the triggering condition clears. Each record retains the trigger, investigation evidence, analyst verdict, approved and completed actions, and resolution timing.
The context graph connects entities such as hosts, users and IP addresses across incidents. A scheduled context engine derives those relationships from logs, traces, monitors, incidents, assets, on-call information and audit records. Traces are ingested signals that contribute to this graph; their availability does not establish that 24Observe replaces an APM, distributed-tracing or RUM product.
The AI Analyst investigates through read-only tools. It gathers graph context, searches logs, examines metrics and retrieves recent changes, then tests possible explanations against the evidence. Its verdict cites supporting evidence, and LLM use requires organization-level opt-in.
When the available tools and evidence cannot establish a confident finding, the analyst escalates to a human. During evaluation, check whether its evidence helps your responder reach a defensible disposition. A fluent explanation alone is insufficient grounds for that judgment.
Choose consolidation or preserve specialization
24Observe appears first below because this section focuses on consolidation. The order reflects that focus, with each approach suited to different monitoring requirements.
| Approach | Best fit | Deployment and trade-off |
|---|---|---|
| 24Observe | Teams seeking shared operations across metrics, logs, uptime, security detections and incident handling. | Hosted or self-hosted. Evaluate the common workflow against your existing queries, dashboards and rules. |
| Prometheus with Grafana OSS | Teams whose priority is specialized dashboards and established PromQL queries and alerting logic. | Self-managed: standalone Prometheus servers collect and store metrics, while Grafana OSS provides visualization. Retain the pair when those specialized workflows remain central. |
24Observe offers hosted deployment and self-hosting. Self-hosting allows monitoring data to remain within your perimeter. Both deployment options use the same API, underlying model, detection capabilities and behavior. Before choosing self-hosting, assess who will handle capacity, disk monitoring, upgrades and recovery procedures.
Keep migration unknowns explicit
Dashboard conversion, PromQL compatibility and rule translation remain unverified in the supplied facts. Do not assume existing Grafana panels, recording rules or alert expressions will transfer unchanged.
24Observe exposes a /metrics endpoint, but the endpoint alone establishes none of those migration capabilities. Require evidence for each dependency before retiring the existing path. If your team depends on heavily customized dashboards and carefully refined PromQL alerting, retaining Prometheus and Grafana may be reasonable even when shared incident handling is attractive.
Which Grafana alternatives and Prometheus alternatives fit different needs?
Identify the layer you need to change before choosing a product. Dashboard limitations call for a different shortlist from metrics-retention constraints. Limited operations staffing and fragmented incident workflows need their own evaluation. Searching for “Grafana alternatives” or “Prometheus alternatives” without making those distinctions can lead you to replace a component that already works.
We list 24Observe first because this article focuses on operational consolidation. Our group built it, so weigh our view accordingly. This ordering reflects our editorial focus and should not be read as an independent ranking.
| Option | Strongest use case | Deployment model | Component replaced or retained | Main evaluation question |
|---|---|---|---|---|
| 24Observe | Bringing monitoring, security detections and incident handling into a shared workflow | Hosted or self-hosted | Can consolidate separate operational tools. Keep Grafana and Prometheus where bespoke dashboards and mature PromQL rules remain priorities. | Does consolidation justify changing the dashboard and alerting workflows your team already depends on? |
| Grafana Cloud | Teams that want managed operation while keeping a Grafana-centred approach | Grafana Labs runs the hosted service, including Grafana and backends for metrics, logs and traces. | Transfers platform operation to a provider; existing Prometheus installations can stay connected. | Is maintaining the platform the main problem, while engineers are comfortable with how they use it? |
| Grafana Mimir | Extending metrics retention and scaling storage horizontally | Open-source backend that your team operates | Replaces the metrics-storage architecture. Prometheus can keep collecting and forwarding samples, with Grafana handling visualization. | Is storage growth the constraint, and can your team run a horizontally scaled backend? |
| VictoriaMetrics | Teams reviewing metrics collection and storage, including specialised cardinality requirements | Open-source software available in self-managed and hosted forms | Covers the metrics layer through Prometheus-style collection and clustering options. Grafana’s visualization role remains separate. | Do the deployment options and query behaviour suit your metrics workload? |
Separate consolidation from managed operation
24Observe fits teams dealing with operational problems across logs, metrics, network monitoring and incident response. Monitoring and security operations share storage and incident records. The hosted and self-hosted versions have equivalent APIs and data structures, with the same detection capabilities and behaviour. Self-hosting also allows teams to keep monitoring data inside their perimeter.
If your main asset is a deeply customised Grafana dashboard library supported by carefully tuned PromQL alert rules, 24Observe is a less suitable starting point. Assess it for consolidation, and check query behaviour and dashboard portability rather than assuming equivalence.
Grafana Cloud suits teams that want to keep Grafana at the centre of their workflow while handing platform operation to Grafana Labs. Its ability to work with existing Prometheus installations puts it on the shortlist for managed operation. Treating it as an unrelated dashboard replacement misses that use case.
Keep metrics architecture distinct from visualization
Mimir supports PromQL and receives samples forwarded by Prometheus, so collection can stay in place when storage changes. Horizontal scaling makes it relevant when retention needs or capacity requirements exceed what a standalone metrics server can handle.
VictoriaMetrics supports Prometheus-compatible pull collection alongside clustering, replication and sharding. Its query language draws on PromQL, which does not establish identical semantics. Test the expressions that matter to your team before assuming the results will stay unchanged.
These are both metrics-architecture decisions. Replacing a backend alone will not address dashboard requirements. Our group’s Grafana alternatives discussion provides related reading; use the same layer-by-layer distinction when assessing the options.
How should you test whether to keep the pair or consolidate?
Use an unscored worksheet to record evidence and unresolved gaps. Compare the configurations in this order:
- 24Observe, built by our group, Networkers Home, so weigh our view accordingly. We list it first as the consolidation candidate because monitoring and security incidents share routing and lifecycle handling. Its hosted and self-hosted deployments suit teams evaluating combined operations.
- Your existing Prometheus and Grafana deployment, including every added component. The self-managed open-source pair suits teams prioritizing metrics, established dashboards and tuned alert rules. Identify any managed services separately.
- Any proposed backend extension. Document what it is intended to address, how it is deployed and who operates it. Test whether it closes the actual gap while preserving the dashboard workflow.
Replay equivalent scenarios
Run the tests in an isolated environment, using matching inputs, observation windows and expected outcomes for each configuration.
| Hypothetical scenario | Test requirement |
|---|---|
| Sustained resource pressure | Maintain a threshold breach, then clear it. Verify duration, host scope and severity against the metric-alert documentation. |
| Application error requiring logs | Retrieve the relevant log evidence, rather than stopping at a metric spike. |
| Failed public endpoint | Exercise an external availability check and restore the endpoint. |
| Suspicious authentication events | Replay synthetic authentication failures against an explicitly configured detection. |
Verify external-check and security-detection coverage in your configured Prometheus and Grafana deployment. Name the components used for each test, including any additions, and record any uncovered scenarios.
For each scenario and configuration, record collection coverage and query results. Note the notification recipient and owner, investigation evidence, and who acknowledged the alert and when. Also record recovery behavior and the number of manual context handoffs.
Check dependencies and operating cost
Before retiring anything, test the existing dashboard queries, variables and data-source connections. Check recording rules, alert expressions, silences and notification routes as well.
| Cost worksheet item | Record for each configuration |
|---|---|
| Staffing | Engineering hours, required skills and on-call load |
| Storage | Ingestion, retention, capacity and backup costs |
| Upgrades | Testing effort, maintenance windows and owner |
| Routing | Configuration owner, escalation maintenance and delivery testing |
24Observe supports gradual adoption: begin with uptime and logs, then add detections and on-call. Verify ingestion paths without assuming automatic imports or Prometheus remote-write compatibility.
Keep the pair if its dependencies remain valuable and operating responsibilities are manageable. Extend the backend if a specific storage or coverage gap dominates. Consolidate only when equivalent tests demonstrate adequate coverage, usable evidence and dependable response ownership without losing essential workflows.
Prometheus vs Grafana FAQ
When should you consider 24Observe instead?
Consider 24Observe for operational and security consolidation. 24Observe is built by the Networkers Home group, so weigh our view accordingly. Its logs, metrics, uptime checks and security detections share storage and incidents. The hosted and self-hosted deployments have the same APIs, data models and detection behavior. If your team has customized dashboards and refined PromQL alerting, weigh that existing investment carefully. Preserving that work can favor keeping Prometheus and Grafana.
What is the main difference between Prometheus and Grafana?
Prometheus collects and stores numeric metrics, using PromQL and rules to evaluate them. Grafana queries connected sources for dashboards and data exploration. There is some overlap: Prometheus can graph results, and Grafana can evaluate alerts. When deciding how to deploy them, separate collection and telemetry retention from display and alert evaluation. Each responsibility needs a clear owner.
Can Prometheus work without Grafana?
Yes. On its own, a Prometheus server scrapes targets, retains metric samples, evaluates rules and displays query results. Its graphs can support direct investigation when you know which metric to examine. Grafana is useful for teams that need shared dashboards or views spanning several data sources. Whether you need both depends on how your team investigates problems.
Can Grafana work without Prometheus?
Yes. Through its plugin framework, Grafana OSS connects to sources including SQL and NoSQL databases. Teams can use it to build dashboards across existing systems without running Prometheus. They still need suitable components for collecting and storing the data. Grafana Cloud offers a different deployment model: the managed service includes telemetry backends.
Can Prometheus and Grafana handle logs and traces?
Prometheus is designed for numeric time series rather than general-purpose log or trace storage. Grafana OSS queries and displays logs and traces from connected backends. In the LGTM stack, log storage belongs to Loki, traces to Tempo and metrics to Mimir. Define your requirements for log management separately from what you need in a dashboard, then assign responsibility for each signal to the appropriate component.
Are Prometheus and Grafana free?
Prometheus is open source. You can download and self-host Grafana OSS with no software charge, though infrastructure and maintenance still require work. Grafana Enterprise adds capabilities in a commercial, self-managed edition. Grafana Cloud is managed by Grafana Labs and offers a free tier. Compare each edition’s deployment model and the operational work your team will retain.
How does Alertmanager differ from Grafana Alerting?
Prometheus evaluates the rules that produce alerts. Alertmanager then groups, deduplicates and routes those alerts, and handles silences and inhibition. Grafana Alerting evaluates conditions through queries and expressions across connected sources, including metrics and logs. Either can take part in notification workflows. Give each alert condition a clear owner and test the notification paths to reduce duplicate pages and fatigue from alerts.
Frequently asked questions
What is the main difference between Prometheus and Grafana?
Prometheus retrieves metrics from monitored targets, stores timestamped samples, and evaluates rules. Grafana queries connected data sources and presents their information through dashboards and exploration tools. Their roles overlap: Prometheus has graphing capabilities, while Grafana supports alerting. The useful distinction is which component collects and retains your metrics and which component helps people investigate and visualize them. They often operate together.
Does Grafana need Prometheus?
No. Grafana can connect to sources other than Prometheus, including databases and other monitoring systems. Prometheus is one possible metrics backend, not a mandatory dependency. Grafana OSS needs suitable connected sources for the information you want to inspect. Grafana Cloud is a different deployment choice because its managed offering includes metrics, logs, and traces backends alongside Grafana.
Can I use Prometheus without Grafana?
Yes. Prometheus can collect and retain metrics, execute PromQL queries, evaluate rules, and display query results without Grafana. Its ecosystem includes Alertmanager for managing notifications from firing alerts. Grafana becomes useful when teams want configurable dashboards, reusable views, and exploration across connected sources. Whether to add it depends on your visualization and investigation requirements rather than a dependency in Prometheus.
How is Prometheus Alertmanager different from Grafana Alerting?
Prometheus evaluates alert rules and sends firing alerts to Alertmanager, which groups, deduplicates, routes, and suppresses notifications according to configuration. Grafana Alerting can evaluate queries and expressions using supported metrics and log sources, then direct notifications. These responsibilities overlap without being identical. Decide where each rule belongs and who maintains notification routing so the same condition does not produce competing operational workflows.
Are Prometheus and Grafana free to use?
Prometheus is open source, and Grafana OSS can be downloaded and self-hosted without a software charge. Running them still involves infrastructure and operational work, including storage, upgrades, configuration, and alert maintenance. Grafana Enterprise and Grafana Cloud are separate offerings with different capabilities and hosting arrangements. Grafana Cloud includes a free tier, but evaluate current terms rather than assuming every deployment has the same costs.
Can Prometheus and Grafana handle logs and security monitoring?
Prometheus focuses on numeric time-series monitoring rather than serving as a log store or SIEM. Grafana can query and visualize logs from connected sources, and the wider Grafana stack includes Loki for log storage. Security monitoring also requires suitable event collection, detection logic, investigation, and response processes. A basic Prometheus and Grafana deployment should not be assumed to provide that entire workflow.
When should I consider 24Observe instead of keeping Prometheus and Grafana?
Consider 24Observe when your requirement spans metrics, logs, uptime checks, security detections, and a shared incident workflow. It is built by our group, so weigh our recommendation accordingly. Hosted and self-hosted deployments are available. Keeping Prometheus and Grafana may suit teams whose existing dashboards and developed PromQL rules are central to operations. Test those dependencies before assuming a consolidated platform can replace them.